
Last week, I showed a 50 year chart of the S&P500, focusing on the P/E over that time period. Today’s chart covers the same issue, only we focus on the 1982-2000 Bull market.
Some people argue that P/E expansion wasn’t all that significant; they say it was (if anything) a function of falling interest rates. In my mind, that only partially explains why multiples expand; It certainly cannot rationalize why P/Es went from 7 to nearly 50 over the course of ~20 years.
Why might the median P/E have run from 7 to 32 during the Bull market?
My explanation is Psychology: something shifted in investor sentiment that made them willing to pay more than $7 for a $1 of
earnings — much more. That change is best explained by a sentiment shift related to perceived relative Value.
>
Click for larger graph

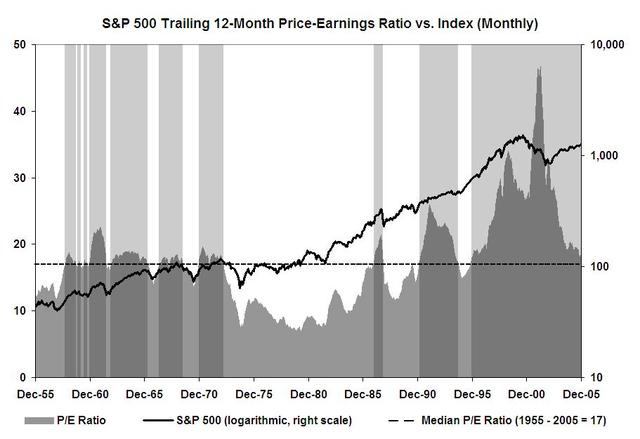
Source: Panzner
>
Most investors do not think P/E expansion as the lion’s share of the market’s 82-2000 gains; Instead, they credit a robust economy, technological advances, productivity gains, and (of course!) earnings improvement.
And all those elements did have an obvious impact — by my math, they were responsible for about 25% of the performance.
But the biggest contribution these four elements had was not to the bottom line; rather, it was to investor psyches that gradually became willing to spend more per dollar of earnings than they had been. They allowed a rationalization of higher prices: Aren’t stocks worth more if the economy is doing well? Doesn’t technology make companies more efficient with their capital? If workers are more productive, went the thinking, than earnings will be all the more better.
Notice how squishy these thoughts are; they may be rational, but they are hardly the sort of easily quantifiable data points that makes for a dispassionate, calculating investor.
more on this later this week . . .

In re, “a function of falling interest rates,” it’s worth doing a cocktail-napkin analysis just to check. Consider the old ddm, where P/E is payout*(1+g)/(r-g). ‘g’ estimates for the market will probably proxy for GDP growth, which is running around 3-4% in real terms. ‘r’ estimates are probably real treasury rates plus a risk premium; risk spreads are low right now, so r is probably not all that far from g. When your P/E is proportional to the inverse of r-g, and g is close to r, then P/Es will indeed be very, very sensitive to rates.
Like some out there, I tend to believe risk spreads and long US rates are both somewhat too low, which means that I agree with your P/E call. However, I do feel it’s mostly a function of falling long rates, and of the associated drop in risk premiums.
Barry, I think your math is about right but when long term interest rates fall, there are many side effects. The trite but true example is that the fellow who refi’s his home feels richer after the refi and is all the more likely to have a good attitude toward stocks.
I believe long US rates are a little high because inflation is so low; the yield curve suggests that rates are headed down.
Greenspan likes the PCED because it leads the CPI core rate. The PCED is flashing small numbers. In recent weeks, the price of oil has started exerting downward pressure on the core rate. Surely the risk of a $10 move in oil is not much better than even money in either direction. We have learned that $70 oil destructs demand significantly.
My bottom line in regard to your post is that PE expansion is likely in 2006 partly because long term interest rates will hold current levels or go lower.
I certainly have no qualifications to comment here, but I do have a question –
Is it possible that P/Es rose due to an expansion of 1) the American investor class (see increased inequality) 2) the overal quanitity of investors (more middle class investment in hedge funds)? In other words more money chasing the same amount of companies?
The most simple answer is always the right one. Your analysis was too complex to possibly be the real answer. I believe the cause for higher PEs is simply more investors. Specially with the rise of deep discount and online brokers, there are far more investors in the market since the 80’s. More money in the market = higher PE ratios.
BR: so if investors ar eleaving equities for Real Estate or commodities, will that cause P/E contraction?
Do we need a more complicated explanation than supply and demand?
If the median 401K investor were to allocate 50% of his contributions to either S&P500 index funds or mutual funds that substantially contain the same stocks, would he even know what the P/E was? If he did know, how likely would he be to cut back on his stock allocation in the face of undeniable success?
If we look at the rest of the investment management population, how can a manager who has actual buy and sell discretion survive if he underperforms the median 401K investor? Which is the larger perceived risk, investor funds walking out the door due to underperformance or some sort of sudden P/E reversion?
As all retirement funds inexorably move from defined benefit to defined contribution, and the Fed continues to inflate away the value of the dollar, how can historical PEs be considered to be anything more than history? With few or no inflation fighting alternatives available to the masses of partially unwilling investors, how can the P/Es of substantial stocks do anything but expand?
Regards, Don
More investors? More specifically, more Growth investors.
Demographics were a significant contributing factor to the increase in GROWTH investors (vs. BALANCED or INCOME investors); therefore dollars being invested in stocks; therefore PEs expanding.
Unfortunately demographics are now a significant contributing factor to an increase in BALANCED and INCOME investors (vs. GROWTH); therefore fewer dollars allocated to stocks; therefore contraction in PEs.
And the process (and acceptance) takes years to unfold. Many still cling to the idea that stocks are an inflation hedge.
The market PE is an expression of the present value of a perpetual stream of 7% earnings –dividend — growth
given current interest rates, inflation and expectations about market volatility, or risk as we now discuss it.
There is no significant evidence that long term earnings growth has shifted from the post WW II trend of 7%, so that is not a reason to expect an upward shift in the market PE. although this was a rational used in the late-1990s. But there is evidence that market volatility, or risk has declined and that could justify a higher pe. In addition, theory suggest that investors demand an after tax rate of return. If this is true the cut in the dividend tax rate should generate a higher PE. However, this is still an unproven theory IMHO for several reasons.
Finally, the chart of the market PE is based on reported earnings. But if you use operating earnings the PE is significantly lower over the past decade. Who knows if reported or operating earnings is more accurate, but I suspect operating earnings are closer to the “truth”.
thanks for posting spencer.
the terminal value and continuation of the dividend tax reduction are uncertain. what is the status of recent congressional action to make permanent the dividend tax reduction?
and there is an election not too far away, and tax-cut extenders in the U.S. House face uncertain prospects.
I think valuations are way too high and that p/e must fall.
But I am not sure in a rational market it will fall to old averages. A long term investor can look at the long term returns which are something like gnp growth + inflation + dividends and just getting covered for the middle item is worth more to most of us than it used to be, plus various mutual funds and etfs let one truly average the returns ofv the markets meaning much less volatility than if one selects a small set of stocks.
Still I think the market is overvalued. I just think it’s new average will be slightly higher.
Barry,
Why are you posting a grah from 2002?
(BR: To show th Bull market P/E peak — The 50 year chart of this, up to 2005, is here: http://bigpicture.typepad.com/comments/2005/12/pe_vs_sp_500_50.html)
The current P/E ratio on the S&P is almost 19x ttm EPS, as of September 2005. When one includes Dec 05 EPS, which is an estimate, the P/E ratio on the S&P is 17.9x ttm EPS. (Source: Standard and Poor’s website, you can click on the link: http://www2.standardandpoors.com/spf/xls/index/SP500EPSEST.XLS)
I believe that the only conclusion that one can make is this:
1. At 7x ttm EPS, the S&P 500 in the early 80’s, there was a great deal of pessism amongst the participants in the “market”.
2. At 32x ttm EPS, the S&P 500 in 2000, there was a great deal of optimism amongst the participants in the “market”.
As Mr. Buffett said, and I’ll paraphrase, you pay a high price for a cheery consensus.
At current levels, the S&P 500 is neither cheap nor dear and, furthermore, given the overall resiliency of our economy in view of high oil prices, war in Iraq, inflation concerns, yadda yadda yadda, the S&P 500 still managed to eek out a gain for the year.
After re-ordering the information, the market is trying to tell you something.
Are you listening?
Holy crikey. I thought a reference to the formula was enough, but I guess not. So: P/E = payout*(1+g)/(r-g), right? We can argue about the flaws in that model, but it’s a simple guide. For convenience, assume payout is 25% throughout.
In 1980, 10-year rates were running 12-14% and inflation at 8%, so real long rates were maybe 5%; with an equity premium of 2%, that gives you an r in real terms of 7%. Real GDP growth through the ’70s pushed 3.5%.
P/E then is 25%*(1+3.5%)/(7%-3.5%) == 7.4.
1980 P/E per a simplistic ddm should have been 7.4 — damn close to where it was.
In 2005, 10-year rates are running 4-5% and inflation at 2.5%, so real long rates are maybe 3%; with an equity premium of 2%, that gives you an r in real terms of 5%. Real GDP growth through the ’90s pushed 3.5%.
P/E then is 25%*(1+3.5%)/(5%-2%) == 17.3.
2005 P/E per a simplistic ddm should have been 17.3 — damn close to where it is.
The market is trying to tell you something all right — real rates are lower now than they were in 1980.
That’s really almost all there is to it.
I always thought the market has two regimes. During one, investors look at earnings, during the other, they look at liquidation value. Value Line used to put out a Dow Jones chart like this with the 1930s and 1970s being value periods. We could be entering another one, if only as a result of demographic resonance from the Great War baby boom and the larger echo baby boom in the 1950s & 1960s.
Of course, I have my hopes. If the tax cuts lapse in 2010, the economy should take off a few years later in response. Hey, it worked the last time several times that taxes went up. It could work again.
I guess I’m surprised at the theme of bullish explanations in response to the graph and commentary on PE expansion. I guess I know who responded to that Businessweek poll.
I’m surprised at how many people discount a return to single digit PEs. Many of the sharpest minds on Wall Street predict it. Even fear it. The blabbering crew of salesmen in the major financial firms tell you it’s always a great time to invest. They are harlots and charlatans never to be trusted. Many technicians, analysts, chief investment officers and more pragmatic firms became pariahs in 1999 and 2000. Many even lost their jobs or lost billions in business for being concerned the market would start a reversion to the mean. They were right and they were punished. There is no room for reason when your mission is to get more and more and more money into the company’s investment coffers.
There is a general conditioning of exhuberance from many of the “younger” investing public, fund managers and financial professionals, most of whom haven’t seen the bear very often sans a brief visit in 2001/2002ish. And one hell of a visit at that. The old guys and gals were the ones puking their guts out in 1987 and many times before when the bear made many more regular visits. 20% returns are not a God given right.
Historical analysis of equities should go back 40-50 or even 100 years to truly understand economic, sentiment and intermarket analysis in my opinion. While I am long term cautiously positive, these responses scare me to death. Many of you might want to make a visit to a site you’ll love. http://www.nofear.com Buy a t-shirt and flaunt your exhuberance! :)
We are at likely ends of some very significant trends that should bring more cautiousness, suspicion and fear. But, nothing convinces someone any better than experiencing those changes in their wallet. Time will tell.
RE: WCW Comments
Thanks for providing the Gordon Growth Model. While that model works well in theory, in reality it blows up spectacularly since small changes in g, r, or b cause the output, namely the P/E ratio, to gyrate wildly.
Of course, one of the key problems with your conclusion is that your basic assumption is wrong. B, or the payout ratio, IS NOT 25%. It is 33% currently!
Furthermore, in the 80’s, the payout ratio was much higher than 25 or 33%. From recollection, the payout ratio was greater than 50%!
Why don’t you put 33% in your fancy financial model and tell me the output?
RE: Kaleberg & (Higher) Taxes
I believe that you are forming a causal relationship between two variables without looking at other factors. From recollection in the late 90’s, there was something called the Internet that became commercially available. New businesses were formed and companies were prolifically hiring without abandon in order to enable this new technology.
The market in general did not go up since taxes were higher. The market went up because the market was attracting capital given this “new” technology.
RE: P/E Ratio and Long Term Interest Rates
There is a strong correlation between the P/E ratio and LT Interest Rates, assuming “clean” or “normalized” earnings.
Of course, if LT rates go into double digits, it is reasonable to expect the P/E ratio of the market to compress.
However, at the present time, it is completely unreasonable to believe that the P/E ratio of the market will miraculously go into the single digits.
As I said before, the market is neither cheap nor dear.
I called the model “a simple guide” precisely because it is not fancy. My point was that a simple guide to PEs indicates their sensitivity to estimates of r and g, and that changes in those two inputs alone could have accounted for all market PE changes. While I would hardly use the model closely to value the market, that is because of the near impossibility of estimating its inputs, not because the volatility of PEs is empirically denied. After all, the gyrations for which you are looking are plain on the chart attached to this post. While your outrage at my comment is clear, I can’t imagine why, as your conclusion about the market congrues well.
Perhaps you simply like to argue. My apologies, then, for being so agreeable.
WcW,
My Apologies. I didn’t have my morning coffee when I read your message.
“My point was that a simple guide to PEs indicates their sensitivity to estimates of r and g, and that changes in those two inputs alone could have accounted for all market PE changes.”
Thanks for articulating your point and I do agree with it.