
That didn’t take very long, did it?
Last week, we discussed Citibank’s Panic/Euphoria chart in A Full Year of Panic ? (I don’t think so). In this week’s Barron’s, Mike Santoli gives Citigroup’s Tobias Lefkovich an opportunity to defend the indicator from a barrage of criticism.
(Incidentally, Barron’s is free this week, so you can read the entire discussion there).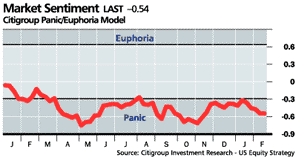
I have several beefs with the Citigroup’s proprietary Panic/Euphoria Market Sentiment indicator:
As we mentioned last week, Panic is a momentary phenomenon — it is transitory. But as the chart at right shows, we have been at Panic levels for about a year. That makes little sense.
Second, the basic concept reflects a flawed understanding of sentiment and contrarianism. Markets go up when the crowd is Bullish; Markets go down when the crowd is Bearish. Merely leaning against the crowd is a sure fire path to the poor house. That concept is the basis of cliches such as “Don’t fight the tape” and The Trend is your friend.”
If you want to use any tool as a contrary indicator, then you are looking for specific extremes — not a year’s worth of sentiment reading. We detailed dozens of examples in the Contrary Indicators piece here.
Next, I must take issue with this statement: “negative sentiment is the condition that tends to precede higher markets by six to 12 months.” That’s simply incorrect, and for several reasons:
– For the most part, markets tend to go up over time. Saying markets will be higher in a year because of XYZ is disengenuous; They statistically are likely to have been higher anyway;
– How much higher? Most U.S. markets are flat to up moderately over the past 12 months; The prior panic indicators don’t seemt o be working (Dow up 1% is hardly a victory)
– The data mining issue is ever present in these backtested models. This tool needs to be tested in the real world — prospectively not form fitted to a past that will not repeat precisely.
There is an easy solution to turning this marketing tool into a potentially useful technical indicator
The two peaks — under the 0.6 level I referenced last week — were decent lows: Early May 05, and mid October 05. Tobias needs to adjust his scale, and move the Panic zone down to 0.6.
Here, I did a quick mock up of what that would look like:
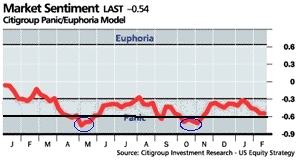

May 2005 was a good low, as was mid-October 2005. Lower the panic threshold, and maybe you got something. (Must I do everything around here? Sheesh)
I understand the difference between marketing and analysis, and this is as fine a piece of marketing as any. With a few tweaks, maybe it could become a decent analytical tool . . .
>
Source:
The Bull Peters Out
Kopin Tan and Michael Santoli, THE TRADER
BARRON’S MONDAY, FEBRUARY 13, 2006
http://online.barrons.com/article/SB113961724924371315.html

Barry,
Maybe you could blog like this:
“Hi, I make a lot of money at this. Go buy EWJ.
Ok, now sell SPY. Good job!”.
Just my $.02.
-Mike
Maybe a third, middle zone between -0.3 and -0.6 would make more sense; call it the “blah” or “blue funk” zone.
Barry,
Just in case you hadn’t seen, you’re mentioned in john mauldin’s excellent piece this morning!
http://www.frontlinethoughts.com/printarticle.asp?id=mwo021006
Also, could you write about why you think equity mkts will rally in the first quarter before a selloff later in the year?
Thanks
In that Mauldin piece, he cites another “panic indicator” used by Dresdner in London that is similar to Citigroup’s.
Except that it is giving off an exact opposite reading right now and showing stocks haven’t been this overloved since May 1996 and Sept 1987 before that.
Everyone knows what happened after Sept 1987, but the action in May 1996 is interesting. The SPX started off the year with a vertical rally (like 2006). Then a choppy sideways-up move for three months that threatened to breakdown or breakout every week or so. Very edgy action, like 2006.
Then out of nowhere, in July 2006, the SPX dropped almost 12% in two weeks, erasing nearly six months worth of gains. After that, the rally continued.
Everyone’s got an indicator. Some are predicting a crash. Others are predicting a major upmove. Any wonder why we remain locked in a tight trading range while the doomers and permabulls duke it out.
I still believe a downside breakdown is coming. Don’t know whether it will come sooner (Mar/Apr) or later (May/Jun/Jul). But it will likely be very fast and take many by surprise. So many are on a hair trigger right now: ready to buy if we break above resistance, ready to sell if we break support.
Still think 1245 (Dec low) is the key. If/when we bust it to the downside, might be a quick move back down to 1090-1120.
Seems like the bullz have redefined the concept of “panic” so that it is unrecognizable any more.
On realmonkey.com yesterday, Mr Rothbert was crowing about how everyone was “panicky” and his clients are “getting scared.” Sissies. The market is, what, 2% off its 4-year highs? Pathetic.
I think these long-only folks have forgotten what panic is. Rothbert says yesterday (2/10) was the “Pisani Panic Bottom” because Bob Pisani at CNBC from the NYSE floor seemed particularly agitated. Exsqueeze me? The NYSE was down 1.9% off its 4-year highs at the time.
Another RealMonkey.com long-only guy, Jeff Bagley, wrote: “Haven’t seen such fear in a while.” His response: buy AAPL.
If you look up complacent in the dictionary, you’d find pictures of Bagley and Rothbert. Look at the long-term trading history of the U.S. markets. They go up, they go down. And usually when they go down, it’s more than 2%.
I don’t predict Dow 6,500 like Barry. And I’m willing to buy fear/panic and sell greed/euphoria as much as the next guy. But a 2% drop doesn’t cut it for me. When these long-only guys at RealMonkey.com start talking about selling stocks instead of buying AAPL calls every time the market dips 1-2%, then I’ll get interested in buying panic.
They need a third dimension, boredom.
Looks like a coincident indicator to me, i.e. useless.
Mr. Ritholtz, of course there’s such a thing as constant panic. That’s the way to get people to vote for you during an ongoing “war on terror.” AIIIIGHHHH! EEEEEEK! OHMYOHMY!
Maybe it needs to be detrended, instead. W/O seeing what a period of euphoria looks like, its hard to tell.
Hard to believe that the number of large players has not taken on a larger role in presribing the prices of any stock. K comes to mind with GM, but why generally isn’t the smaller player at the mercy of those who have real tools to use than these cute little graphs? Why, in this time of flat spreads, isn’t manipulation by the larger players whose primary field is not so lucrative, more of a concern?
Unlike Lord, I see the daily swings as evidence of the manipulation at work: the boring creep sideways perspective as seen from weekly or monthly changes misses what seems to me, record daily volatility.
Forget about the teminology, Barron’s should show data going back 10-20 years and tell us when it was first used. My guess is that it is just one of those back tested calculations which won’t work in the future. Shame on Barron’s.
Its not just the sentiment that counts but how much price is rising relative to what people expect to see. There was a record high short interest at the 1929 high. The market fell 89% from there. In 1929, the Wall Stree Journal opined that the huge number of bears meant that the market could not fall further. That was in early October, 1929. … there were a lot of bears and skeptics throughout 1968, too. On the largest trends, you often hear that sentiment indicators “don’t work,” when in fact they are giving the biggest signal in their history. The 1979 stock market rally end after holding up day after day for a month despite terrible news, heartening many investors. the situation resolved in the October massacre. Context is important. Proceed with caution.
Too many bears become an indicator of a bottom only after a DECLINE in prices.
Like alot of other human emotions, panic is a relative type of phenomenon. Due to macro circumstances, the level that consituted “Euphoria” in pre-2000, is probably alot lower today. Likewise, the potential degree of panick possible for today, is probably alot lower than anything thus far on the chart.
Emmanuel-
The DailyKos chatter is annoying here.