10 Bullish Charts, Signals, Indicators
Earlier this week, we discussed several anecdotal pieces of evidence that suggested we were closer to the bottom then the top.
Today, we look at specific data and charts that can provide some insight as to how extreme these present levels are. All these suggest to us that we are increasingly close to a bottom that can be purchased for an upside trade of 20-30% from these levels.
NOTE: We scale in over time, in 10% increments, and recognize that the bottoming process can take several months to several quarters to complete. Hence, slowly buying in is the key.
~~~
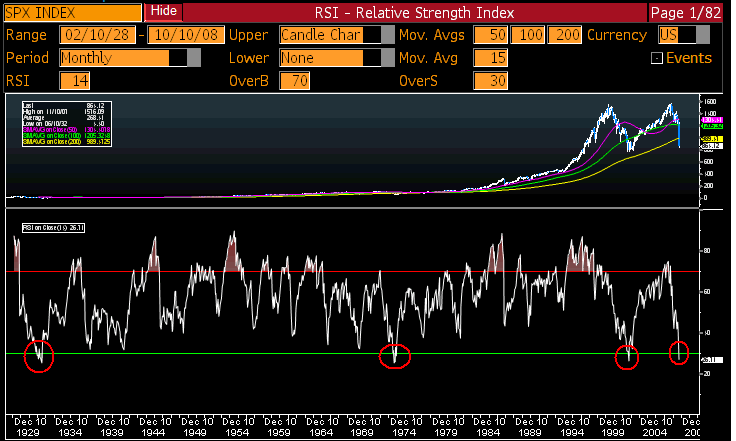
1. Relative Strength Indicator, SPX, 1928-2008
Ever since the beginning of the S&P500, the RSI’s monthly indicator has only dropped below 30 on four occasions: 1929, 1973, 2002, and 2008.
All 3 prior instances were very close to lows.
~~~
2. SPX Losses
The S&P has given up nearly the entire gain from the 2002-03 period to the October ‘07 highs.
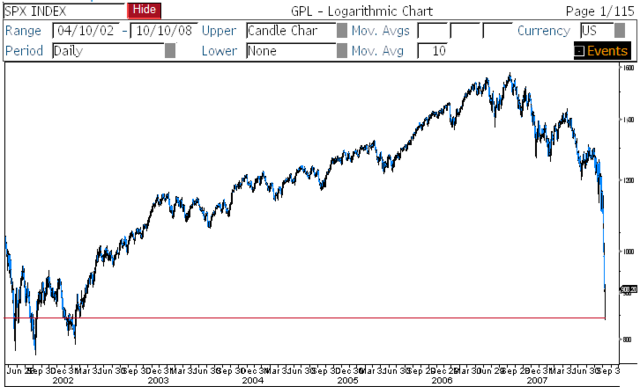
This is a major correction that, like the many trading rallies in the 1970s, should set the stage for the next leg up.
Note that these were not buy and hold rallies, but 6 – 18 month trades.
~~~
3. Dow Components and the 200 Day Moving Average
All 30 Dow stocks are below their 200 day moving average — a condition that has only occurred once before — and the last time was right after the 1987 crash.
~~~
4. Cash Allocation
Investors current allocation to Cash is well above its 21 year mean and are at the highest levels since ’02, ’98 and ’90 lows.
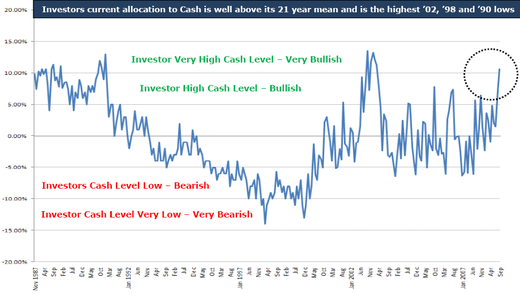
Chart courtesy FusionIQ
~~~
5. 90/10 days
This week has seen three 90% downside days, reflecting massive liquidations.They can only continue for so long.
As noted above, we believe in scaling into long positions. We would become more aggressive buyers after the first 90% upside day. This has historically created a good entry for a 1 to 3 to 6 month holding period.
~~~
6. Percentage NYSE over 200 Day MA
The percentage of stocks trading over their 200 day moving average is at multi year lows:
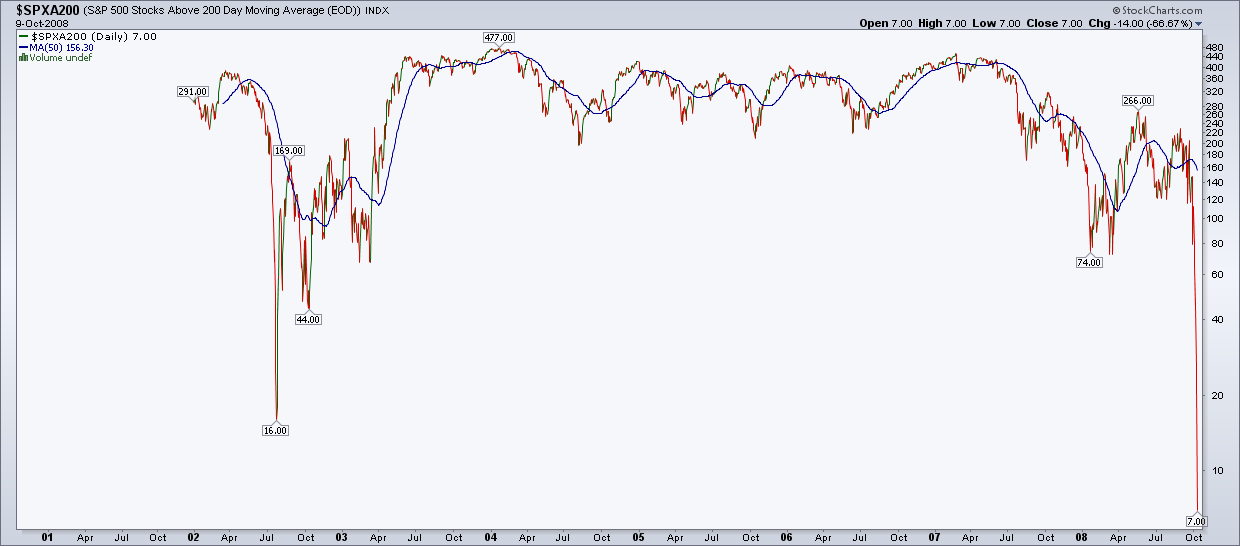
Yet another historically excellent entry point.
~~~
7. Gold vs SPX
The cost of an ounce of Gold is now greater than the S&P500; This last occurred in the early phase of the 1982-2000 bull market — around 1984.
~~~
8. VIX Moving Average
The VIX (also known as the Fear Index) hit a multi-year high of 70.90, reflecting extreme levels of emotion in the markets. We like to look at this on a 50 day moving average
VIX Deviation From 50-Day Moving Average
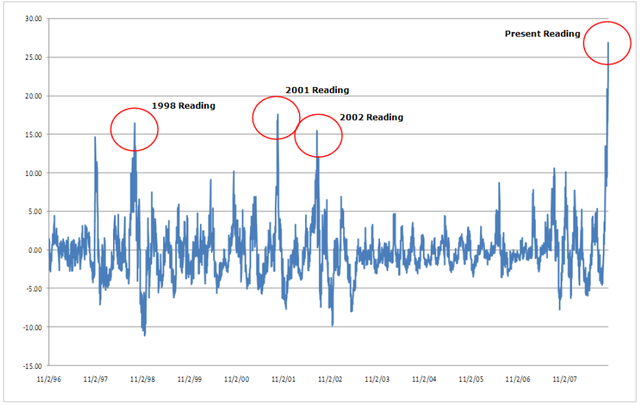
Readings above 15 over the last 10 years have produced significant rallies. The present reading on this indicator is 26!
1998 Reading Market Up + 27 % (3 Months Later) and + 36 % (6 Months Later)
2001 Reading Market Up + 22 % (3 Months Later) and + 22 % (6 Months Later)
2002 Reading Market Up + 14 % (3 Months Later) and + 19% (6 Months Later)
If History bears out this should be a good buying opportunity with a 3 to 6 month horizon.
~~~
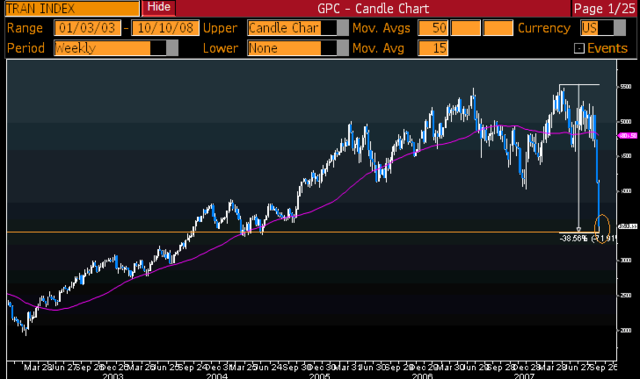
9. S&P500 is down 47% from its peak level one year ago. Transports are down 38%. These are relatively rare degrees of loss, and suggest a near term upside move.
~~~
10. The following two charts show the 2002 lows, and the current market. Can you tell them apart?
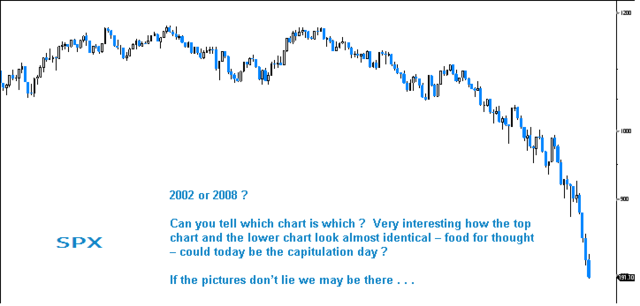
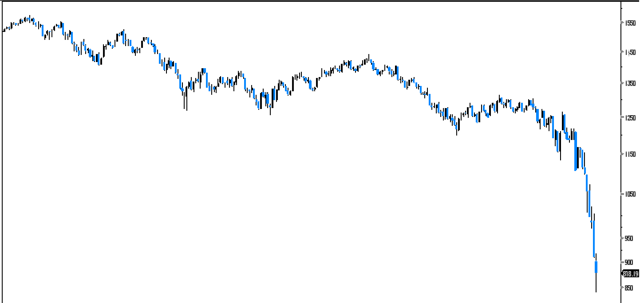
Highlight for answer: The first chart is 2002, the second chart is current as of 10/10/08


October 10th, 2008 at 12:35 pm
Should get a very signficant rally from November 1st to January 15th.
October 10th, 2008 at 12:40 pm
Barry: I flipped the one year BJIA chart yesterday. If the flipped chart represented a stock, I would have shorted it today.
October 10th, 2008 at 12:40 pm
the s+p will have its countertrend rally at some point but it’s truly a guess as to where it commences. we are in liquidation deleveraging crash mode and all indicators might as well be tossed out the window. hope the discilpined one;s get their rally but i’m afraid it won’t be as great as most think.
October 10th, 2008 at 12:42 pm
Once the credit crisis is fixed, maybe.
If there are several hundred TRILLION in derivatives going broke, then I’ll wait.
October 10th, 2008 at 12:45 pm
%Stocks below 200 DMA & 50 DMA at 1987 crash levels….close to 0
October 10th, 2008 at 12:45 pm
%Stocks below 200 DMA & 50 DMA at 1987 crash levels….close to 0
October 10th, 2008 at 12:45 pm
May or may not be relevant, but after the ’29 crash, the Dow rallied 35% (11/14/29 to 4/15/30).
Surely the SPX can muster a 15% move in the next rally.
October 10th, 2008 at 12:47 pm
I have the odd thought that we’re going to be looking back, and wondering if DJIA 10000+ was just a ‘dream’…
One thing is for sure, this current Chapter will be entitled: “Mission Accomplished”
October 10th, 2008 at 12:48 pm
Barry, please please don’t get pissed. You have done a fabulous job presenting a contrarian view for a long time and you capably represent those of us who are less optimistic to the rest of the world.
But does anybody know of any other good blogs that represent a really pessimistic view of the world? I don’t mean an appeal-to-authority, ad hominem, immature sexist rant blog like mine, but something that consistently makes convincing analytically based arguments that we remain far, far from even thinking about bullish indicators.
October 10th, 2008 at 12:52 pm
Dear Barry
I’ve been studying the “credit default swaps” market for some time. It is said that there are $58 trillion of these outstanding. Though some are off setting many may be built on leverage and unreserved.
What will happen as a result of the Lehman auction today and similar events is that those solid institutions that underwrote CDS contracts which they than turned around and hedged with an off-setting CDO will still be obligated contractually for the CDO they underwrote while losing their protection to a bankrupt counter-party. They will than have unhedged exposure and may be taken down by the same bankruptcy or another depending on whom they underwrote. A few major bankruptcies will take down the whole $58 trillion edifice like a “house of cards.”
The only way to resolve this is for the U.S. government to declare “force majeure” and annul these contracts. Parties will be relatively little scathed financially as they will lose only the premium flow and un-callable protection where they have underlying securities to protect.
An Economist
Steve Sposato
October 10th, 2008 at 12:54 pm
good call barry..
i am selling far out of the money puts at this levels.
AAPL strike 45 puts are yielding nice premiums.
msft strike 15, intc strike.
choose any stock…and discount by 20-30% (crash scenario) and if you think it is cheap, you go ahead and sell the puts.
but keep plenty of cash for margin(in case market crashes).
i am starting with 20% of my cash, will add 20% after every 10% drop in my specific stocks.
worst case scenario….we may get a 50% sell off. but if we have enough margin money, our puts wont hurt.
volatility is at record high its time to sell it.
October 10th, 2008 at 12:56 pm
BR is correct, there are bullish indicators out there that suggest opportunity is nigh. Watch the price action as that will tell when it is true or not. Probably very close to a bottom/floor for price levels.
October 10th, 2008 at 12:59 pm
It’s contained!
(sorry for the redundancy)
October 10th, 2008 at 1:01 pm
For the past 5 years, we were told to ignore the excessive leverage, the trade deficits and the “one way carry trade” because it’s “different this time”.
The irony is that since it turned out that it wasn’t “different this time”, we’ve now reached a point where, indeed, it may actually be different this time.
Nonetheless, you make a compelling argument, though…
October 10th, 2008 at 1:02 pm
The liquidity crisis is on its way to be solved through our hard work (selling papers and derivatives) pushing liquidity in our coffers and scaring our piggy bags, and we are not ready to resume the up trend until we get full attention of our bail out governments .
We have since two weeks discovered our predicaments and thank you for noticing!
October 10th, 2008 at 1:03 pm
Wow – Did CNBC just quote Greenspan as saying he sees a bottom in housing in the first half of 2009? He’s needs to stay quiet.
October 10th, 2008 at 1:03 pm
Isn’t the sum of all these “indicators” really just the thought that “Hey, we are so far down that we have to go up from here.”
October 10th, 2008 at 1:14 pm
Wonderful stuff Barry, and rational as ever. It’s just a very, very long day for rational beings today, when we are surrounded by lizard brains who are determined to lock in their losses…
October 10th, 2008 at 1:16 pm
Can’t disagree, for the most part. The market is in a position to buy back in a big way as soon as it looks safe. It won’t stop falling until the bad new stops coming on a daily basis.
On the good side, all this new government liquidity should propel the markets to a good place when the ballast is dumped.
McCain finally had a good idea. He wants to temporarily stop mandatory withdrawals from IRAs for those over 70. It just goes to show, if you give a monkey a typewriter, eventually something that looks interesting will emerge.
October 10th, 2008 at 1:17 pm
28-08 chart looks like Al Gores global warming and intense hurricane frequency stats
October 10th, 2008 at 1:17 pm
Well, Mr. Obvious, I think you are ignoring the goat-bones evidence when you can see it quite clearly there before you.
October 10th, 2008 at 1:17 pm
Similar evidence from Faber’s quant model that is 100% in cash – has only happened 4 times before….
http://worldbeta.blogspot.com/2008/10/100-cash-out-of-sample-returns-and.html
October 10th, 2008 at 1:20 pm
Equities go up if cash flows into equities. I don’t see cash flowing into equities. Have you studied the charts around 1929? The sucker rallies were devastating.
October 10th, 2008 at 1:20 pm
Raise your hand if you want to hold
over the weekend?
Anybody??
Seriously, the rally would have been good on Wed. or Thurs.
October 10th, 2008 at 1:20 pm
I’m flat. Made a killing this week long volatility. Staying in cash until we hit some kind of support.
October 10th, 2008 at 1:21 pm
DL,
The rally in 1930 was followed by even deeper declines until the Dow bottomed at 41 in 1932, an 89% “correction” from its highs in April of 1929. It muddled along for another decade until the war precipitated a lasting rally.
Although I don’t doubt some smart people here have the capability to do so, I have very little confidence that I could time or know the bottom. IMO this is a secular bear market, from which recovery will take years.
I’m staying long guns, butter and beer.
October 10th, 2008 at 1:21 pm
This will kill you, Barringo.
While I’m emailing you privately, wife says:
“Eclectic, where’s the market now?”
I look and it’s down 417 and I say “Take a guess.”
“Down 100″ says she.
“No… 417″ says I.
“Well, that’s the ‘New ”’Down 100”’ ‘ ” comes her retort.
October 10th, 2008 at 1:23 pm
Who is left to sell? Seriously, are people that stubborn, is their risk management really that bad that they decide to sell now? Think of all all the buy and hold investors who were scammed by Wall Street, it really is a shame.
October 10th, 2008 at 1:26 pm
The reason the charts look the way they do is because there’s a reason.
How many times have we been in this situation before? Is this a time to use “normal” analysis?
October 10th, 2008 at 1:26 pm
good call barry..
i am selling far out of the money puts at this levels.
AAPL strike 45 puts are yielding nice premiums.
msft strike 15, intc strike.
choose any stock…and discount by 20-30% (crash scenario) and if you think it is cheap, you go ahead and sell the puts.
but keep plenty of cash for margin(in case market crashes).
i am starting with 20% of my cash, will add 20% after every 10% drop in my specific stocks.
worst case scenario….we may get a 50% sell off. but if we have enough margin money, our puts wont hurt.
volatility is at record high its time to sell it.
Posted by: aram | Oct 10, 2008 12:54:27 PM
aram, good for you, someone that understands fading volitity, and ‘getting paid to long(sythetically)’
nice charts BR, way to keep on keepin’ on ~
October 10th, 2008 at 1:29 pm
Great Depression vs Today}g graph:
http://spreadsheets.google.com/pub?key=pGy0BQU1PZ9AYrZgFwaFWHQ&oid=2&output=image
I threw that together from Yahoo’s historical data. Basically, I took the data and did %change for each day. Then I found the high before the depression (381.17 on 9/3/29) and put in our high (14164.53 on 10/9/07).
Blue & Red = Dow in Great Depression converted to our numbers today (starting with our high, and then loosing/gaining x% daily)
Yellow = Actual true numbers as of yesterday.
The good news is if we followed the track all the way down, DOW would get down to 1531! I dont see that really happening.
October 10th, 2008 at 1:31 pm
nice spelling,
make that ‘volitility’ and ’synthetically’
@Donkei, you want to 2xDown! IOW: I agree.
October 10th, 2008 at 1:32 pm
There’s an article on the CNN website about the financial problems at GE. There’s nothing in here that would come as any big surprise to regular readers of TBP. But it may help shed some light on why the executives are so intent on trying to brainwash people through its CNBC subsidiary:
http://money.cnn.com/2008/10/09/news/companies/colvin_ge.fortune/index2.htm
October 10th, 2008 at 1:34 pm
brian..
its forced selling.
people pulling out of mutual funds in their retirement funds.
hedge funds deleveraging due to redemptions.
in other words market is not trading on fundamentals, hence its time to risk 20% of capital, with 30% downside protection.
Donkei…i dont think we will se 1930 style depression any more….
long recession yes……but central bankers will print their way out of this asset deflation.
my only worry is at the incompetencies of central bankers or treasury chiefs…..since so far they were reluctant to plan for worst case scenario.
October 10th, 2008 at 1:34 pm
The only way to resolve this is for the U.S. government to declare “force majeure” and annul these contracts. Parties will be relatively little scathed financially as they will lose only the premium flow and un-callable protection where they have underlying securities to protect.
Glad I’m out of SKF/SEF then…
(startin to look at SNHY, XNPT as the least scary things to pop up on my high-value/low-debt screener.. Apologies in advance if mentioning actual stocks is bad manners..)
October 10th, 2008 at 1:41 pm
>rally in 1930 was followed by even deeper declines
Yeah that whole “1929, 1973″ thing isn’t making me feel any better. Neither of the following decades are exactly fondly remembered.
And ‘02 was greeted with the second (and maybe fatal) implementation of “blow up a bubble, any bubble” thought process. Let’s hope that has been discredited.
Yeah, of course the market will recover, but this looks like Shock doctrine at its most sophisticated – which means that the market will again be the provenance of the rich, as the masses will simply be told that they cannot be paid enough to buy sh*t.
At least in ‘73 there were pensions and health care wasn’t so good but it was cheap (pretty much any major medical event had a good chance of killing you off pretty efficiently).
October 10th, 2008 at 1:42 pm
I only need a bear market rally and I will be settled. Until then I am going to continue to buy and increase my long positions in stocks.
Why are so many almost fully in cash near the local price minima? I usually am mostly in cash around the local price maxima.
I can understand, when people with a long term horizon are in cash in times likes these. I moved my retirement funds 100% to cash in spring last year. But traders with a short term horizon?
rc
October 10th, 2008 at 1:45 pm
Went long last couple days, down about 5% right now. You could say I’m a bit nervous. Any of you trader-folks have a good stop-loss level in mind? Don’t want to get shaken out before “the” pop if it happens, but don’t want to be left holding the bag either. S&P 830?
October 10th, 2008 at 1:49 pm
OK, Barry is turning bullish. That’s a good sign.
But have the permabulls turned bearish? Cramer just has. Who else?
rc
October 10th, 2008 at 1:50 pm
on the longterm monthly charts, only the RUT, the $BTK and the trannies haven’t decisively pierced their 200 month moving average. are you suggesting a bounce back up to that ma? even the ‘02 lows only took most of the major indices down to or just under that line. ($spx just under 100 month ma). a rally which fizzled at that the 200 month sma would result in a most ominous looking chart, with dire longterm implications. scary days.
October 10th, 2008 at 1:51 pm
did anyone think of Katrina, as Bush spoke this morning? Reminded me of his press op after Katrina when he listed the truckloads of ice, beds, etc That did not work either. If you are going to have a major hedge fund crash every few days, the unwinding of cds contracts every week, how do we get to a bottom? I hope you’re fight Barry, but fundamentals are shaky in this environment IMO.
October 10th, 2008 at 1:51 pm
dead hobo:
How is that going to stop anything? Are forced withdrawals that big an issue now? If most people in retirement age are still in stocks, they have more problems than forced withdrawals. Shouldn’t most people of retirement age have most of their money in safer investments?
October 10th, 2008 at 1:55 pm
Is anyone betting on the Dow closing below 7,500 today? I’ll take $5 on the under.
October 10th, 2008 at 1:55 pm
Is anyone betting on the Dow closing below 7,500 today? I’ll take $5 on the under.
October 10th, 2008 at 1:55 pm
Is anyone betting on the Dow closing below 7,500 today? I’ll take $5 on the under.
October 10th, 2008 at 1:57 pm
dunno folks. When you have a G-8 leader (Berlusconi) talking about shuttering the exchanges – though he later denied it – then you are taking a big risk having your money in stocks. Plus, they are floating new anti-shorting rules.
Notwithstanding the initial bounce, this market has gone straight down since the authorities started rigging things. I’m a trader and a gambler like the rest, but if you have a serious operation managing other people’s money, how can you conduct business when the government keeps blowing up your risk-management models and tools?
October 10th, 2008 at 2:00 pm
I have a question regarding No. 4, Cash Allocation of Investors.
How is cash allocation of investors being measured?
I ask because there is always someone in cash, and the sum over all the cash in the system shouldn’t change, should it? Each trade has two sides, a buyer and a seller. When someone buys an asset, someone else realizes a cash amount. The cash doesn’t just vanish into subspace during bull markets and re-appears during bear markets. Thus, how come that the total cash allocation of investors changes between bull and bear markets? How is it measured?
rc
October 10th, 2008 at 2:01 pm
I was tempted to go long until I read the posts of those…who are already going long.
Waayyy too clever. This market’s all about punishing those who think they are smarter than everyone else….from the quants all the way down to the types who go long, because Cramer said to sell…or knock the “average investor” or the “MSM types”….
This market’s all about pile driving The Too Clever Trader.
October 10th, 2008 at 2:02 pm
Predictions:
9/14/08 DOW 6,000 in 2010
10/1/08 DOW 6,000 in 2009
10/10/08 1:23 EST DOW 6,000 in October
10/10/2008 2:03 EST DOW 6,000 at closing today
October 10th, 2008 at 2:09 pm
Joe Klein’s C.: many people were given stock as part of their retirement package. There are a LOT of hurting 55+ out there, the younger ones not having that much longer to save, the older ones seeing their retirements dwindle. And this time, unlike earlier this decade, there probably isn’t any bubble coming forth to save them (ALTHOUGH, we should never discount the conniving of those who would like to separate money from the masses, maybe they’ll come up with something, despite the fact that the masses have no money, and NO MORE CREDIT).
I put everything in money markets when I was down about 8% from the October high(right before a bear-market rally, but nobody can time things perfectly). Yes, it hurts to make 0, but it hurts a lot less than tanking another 30%.
October 10th, 2008 at 2:15 pm
so, is the big, bad, Lehman event over with??? What happened?
October 10th, 2008 at 2:15 pm
BK:
I understand that, but is that what is causing these problems? Is stopping the automatic withdrawals going to stop all the cliff diving we’ve been seeing? Fundamental changes need to be made, not solutions that tinker at the edges.
October 10th, 2008 at 2:15 pm
BK:
I understand that, but is that what is causing these problems? Is stopping the automatic withdrawals going to stop all the cliff diving we’ve been seeing? Fundamental changes need to be made, not solutions that tinker at the edges.
October 10th, 2008 at 2:15 pm
BK:
I understand that, but is that what is causing these problems? Is stopping the automatic withdrawals going to stop all the cliff diving we’ve been seeing? Fundamental changes need to be made, not solutions that tinker at the edges.
October 10th, 2008 at 2:16 pm
A nice set of charts. I tend to look more at simple long term fundamentals like PE ratios. The SP500 is just now down to it’s long term average. Psychology is the driver in the stock market, but perhaps we’re at a tipping point where we stop the “Lake Wobegone” thinking that “all our women are beautiful, all our kids are above average”, and even in these treacherous times, our PE ratios have to bounce back to well above average. See the post at http://economix.blogs.nytimes.com/2008/10/10/how-cheap-are-stocks/
October 10th, 2008 at 2:29 pm
Similarity of market charts are common
if You know Elliott Wave.
You can find similarities between diferent markets and diferent time frames.
This crash was also obvious if you noticed series of 1’st waves.
Greetings from Poland
October 10th, 2008 at 2:30 pm
Check out the 1974 bottom. Marketwatch’s BigCharts will let you do that with its custom dates.
The ‘74 market looks almost identical. A long roll over followed by a waterfall collapse. It even bottomed in early October of that year.
What happened next was a sharp rally into November, a secondary test in mid December and then the beginning of the new 75-76 bull market.
So maybe the ‘74 is good blue print for today’s market
Hope so!
Adrian
October 10th, 2008 at 2:30 pm
But where is the next bubble? Er I mean economic productive boom.
October 10th, 2008 at 2:31 pm
Datacheck,
A P/E ratio isn’t a fundamental indicator, much to the chagrin of CFA types. They’re technical indicators because they measure sentiment.
October 10th, 2008 at 2:32 pm
I have my straddles set up for the weekend action. However I am still looking forward to another “WTF just happened?” post from Barry.
Volitility should be through the roof over the next few months with the election, transition and first 100 day events. I expect this to be a long and deep recession as it will take some time for the hits to the Banks and Wall St. to work their way through the rest of the economy, unless the US Gov raises rates and starts up the presses.
October 10th, 2008 at 2:38 pm
GM may announce production cuts, closings.
http://www.msnbc.msn.com/id/27101859/
Now they have a market capitalization of 2.7 billion with long term debt of 35.5 billion, but they say declaring bankruptcy is not on the horizon…
As I read it then, the production cuts mean your GM car will now come without tires, which will have to be purchased locally to drive it off the lot…
Makes about as much sense…
Bullish signals when in two weeks we may have all 3 of the big three out of business…
Buggy whips, anyone?
October 10th, 2008 at 2:40 pm
SELL SELL SELL!!! CASH is KING as Jim said.
Forget Gold! Forget Oil! Forget equities! But CASH! CASH is the only place to hide!
October 10th, 2008 at 2:43 pm
It is interesting how some financials are actually doing quite well right now (COF, JPM). I’ve had a feeling all day that we would see a big rally into the close based on this glimmer of hope. Who the heck knows…
October 10th, 2008 at 2:45 pm
Bruce: I think Alain Ducasse had a $100 burger at one of his restaurants at one point. Pretty sure they don’t have a market for that any more, but it is on its way to you.
Cheers, lb
October 10th, 2008 at 2:47 pm
@Dan Duncan:
If you refer to me, since I mentioned Cramer. I have never said to buy, because Cramer said to sell. What I wrote is just an expression of my hope and fears, but I don’t make trading decisions based on that sentiment. I neither listen to bulls (in an affirmative or contrarian way), nor to bears, nor do I bottom guessing, or any guessing for my stock buying. I use a mathematical-statistical approach analyzing price and volume movements based on a large sample of stocks.
I don’t know when the rout will be finished. I only know that we are getting closer to a local bottom day by day. I very much doubt that will be The Bottom, though. The general economic environment just looks too bad.
I always have thought a crash test for my algorithm would be nice. The retrospective simulations, which included the bear market of 2000-2003, worked fine. But real live trading is still another thing. Now, for the last few days, I have been thinking, be careful what you wish for you just might get it.
rc
October 10th, 2008 at 2:48 pm
Don’t pay any attention to the little ups and downs in the market.
October 10th, 2008 at 2:49 pm
@Leftback:
Thanks. Once I have a chance to digest it and this week’s market action, perhaps we can put another wager together for next week.
I notice the Lehmen dreck went for less than expected….or should I say, less than hoped.
October 10th, 2008 at 2:49 pm
Seriously. With prices down on gold/silver today, I want to buy physical gold coin. I’ve checked with all local and many national deals – Monex, Kitco, etc.
Does anyone here have a contact to buy from?
October 10th, 2008 at 2:51 pm
Oh, forgot to add – all dealers are out with no idea when they can’t get resupplied.
Doesn’t make sense that the price is where it is. Demand is very high, supply about non-existent
October 10th, 2008 at 2:55 pm
TED spread 4.62.
Perhaps if Hank would just get down on one knee…
October 10th, 2008 at 2:56 pm
@Bruce in Tennessee
“I notice the Lehmen dreck went for less than expected….or should I say, less than hoped.”
What impact will that have on the other parties of the contracts? More BK?
October 10th, 2008 at 2:58 pm
From nakedcapitalism.com:
“U.S. stock exchanges may seek to impose a temporary ban on short sales for individual stocks that plunge as regulators seek to rein in short-selling. … … Under the plan, a stock that closes down more than 20 percent would be protected from short sellers for the following three days, the people said”.
More screwy micromanaging.
October 10th, 2008 at 3:00 pm
Stock market = Das Boot
October 10th, 2008 at 3:01 pm
kelja, you can try tulving.com. of course, they are sold out, too. i noticed they had bars coming in next week…
October 10th, 2008 at 3:01 pm
barry, I agree with you!
its 2:59 pm and i am buying near term in the money oex calls hand over fist here.
lets bounce…
October 10th, 2008 at 3:02 pm
Bruce in Tennessee @ 2:38:29 PM
With Obama in charge, and 60 Dems in the Senate next year, you can bet that there’s a BIG bailout for GM and F.
October 10th, 2008 at 3:04 pm
Well, it means those who guaranteed the debt will have to pay more out than they’d hoped…Leftback or Karen or Steve could probably answer the bk part…
October 10th, 2008 at 3:05 pm
“Isn’t the sum of all these “indicators” really just the thought that “Hey, we are so far down that we have to go up from here.”"
Yeah, I thought the same thing. Are you really buying into this post, Barry, or just seeing what others think? I mean, there will come a point where that is true… sort of. I’m wondering if there will be a rally with this, just a lot of daily +- 400 point days stretching out for a year because there isn’t any real value in the market, just speculation.
October 10th, 2008 at 3:05 pm
“The horror… the horror…”
horrified spectator – that just about describes my state of mind right now….. still, I have a whole bunch of dry powder and we live to fight another day, that’s the main thing. Mish has a whole post on Elliott wave stuff today. I always thought that stuff was screwy but perhaps it is a valid model of mass hysteria, and that is pretty much where we are this week.
October 10th, 2008 at 3:06 pm
5 steps to apocalypse-proof your family:
1. Pick a “sacrifice child”. This is the child you will leave behind to distract the cannibals hot on your tail.
2. Stop bathing IMMEDIATELY. Humans are attracted to positive fragrance. Foul-smelling meat will be the last to be eaten.
3. Set attainable economic goals for yourself. Select a number of abandoned homes to loot each day and STICK TO THAT NUMBER!
4. STAY POSITIVE!
5. Practice fire-building NOW.
October 10th, 2008 at 3:07 pm
Lehman came in at 91.375. From Bloomberg, check out the following:
“Based on the results, sellers of protection may need to make cash payments of more than $270 billion, BNP Paribas SA strategist Andrea Cicione in London said. The potential payout is higher than the 90.25 cents indicated by initial results from the auction earlier today. Lehman bonds traded yesterday at 13 cents on the dollar, suggesting a payout of about 87 cents was expected.”
Damn.
And BTW: Morgan Stanley’s down 40%.
October 10th, 2008 at 3:08 pm
agree w earlier comment by Sposato, someone needs to nullify all derivatives, CDS etc, just zero them out, zero out the bankers traders associated w the effort, zero out the investment banks, put a firewall around commercial banks and deposits, start spending money from the bottom up. somehow i dont believe a 35-yr old kid w limited experience, all of that at GS sucking up to CEOs, is going to figure this out. time for major hitters Buffett etc to be given fiat control of banking system
October 10th, 2008 at 3:08 pm
Technicals and Fundies both dont mean dick when there are no buyers.
And thats where we are.
No buyers.
October 10th, 2008 at 3:09 pm
Perhaps if Hank would just get down on one knee…
Methinks he’ll be needing kneepads and mouthwash at this point…
October 10th, 2008 at 3:10 pm
What do you expect MS to be in a few weeks? Another bailout?
October 10th, 2008 at 3:12 pm
But to me it means that the other collaterized debt by other companies than Lehman are worth less than hoped. I mean the reduced hope for Lehman was that it would bring 9.75 cents and it brought what 8.6? So it means the other debt obligations are worth less by association, which can’t be good news for the guarantors of that debt….
..just my opinion. I would see this auction as slightly negative in the big picture of things…
October 10th, 2008 at 3:14 pm
collateralized..sheeesh….
October 10th, 2008 at 3:17 pm
up 55 s&P (17 min) points from 2:59 I m peeling them off here.
barry, you missed one. Bradley model says small rally here for another three days or so then decline resumes heavy into december 14th.
sweet…
October 10th, 2008 at 3:19 pm
Coming well off the lows here……
How will this nightmare finish this week?
And begin next week?
October 10th, 2008 at 3:20 pm
If a stock is undervalued, the business will buy it back. If GM was undervalued, they would be buying back shares today. If GM has no capital to buy back shares, perhaps the valuation isn’t low after all?
My econ professor said it best: “Keep in mind that every time you buy a share of stock with the belief that it will go up, the person selling it to you has an equal and opposite belief that it will go down.”
Charts and graphs are why we are seeing so many sucker’s rallies. The unthinkable is happening. If you are smart, you will wait for the typically long bottom rather than becoming one of the “dead money” suckers.
October 10th, 2008 at 3:21 pm
wow, great call BR. Looks like we’re heading into a constructive finish.
October 10th, 2008 at 3:22 pm
Does anyone here have a contact to buy from?
Posted by: Kelja | Oct 10, 2008 2:49:59 PM
Kelja,
what kind of qty. are you talking about? and, what kind of premium to Spot are you willing to pay?
to most decent dealers, that what it breaks down to. the only shortage, in this market, that I’ve found, is in the willingness to pay the Premium it takes to pry it loose.
past that, tread carefully, retail coin/metals dealers are notorious viper dens..the Good ones are few, and Far, between.
October 10th, 2008 at 3:22 pm
Made 5% on SDS, DXD, SKF, QID buying this morning and closing a few minutes ago.
I think this might actually be it for a while, and we’ll see some upside from here.
October 10th, 2008 at 3:27 pm
Is the PPT alive and well? Jumped on some SSO and UYG, tight stops.
October 10th, 2008 at 3:28 pm
So, opinions on the bases for the “rally” at 3:15 ET?
My 2 cents is short covering because conventional wisdom is that shorts have more to fear over the weekend from G8 actions. They are trying to get out early in case of a runup.
October 10th, 2008 at 3:31 pm
So either the market is about to re-stabilize, based on historical precedent and data, or we’re looking a meltdown worse than historical precedent and data can determine…
Does one of those statements seems less plausible than the other?
45 trillion dollars is a lot of money.
Q: What percentage of the CDS $45tr amrket is considered to have been, or be, bad risk?
And what will a worsening economy do to the CDSs that are on the cusp, when formerly solvent american homeowners find themselves too much indebted, based on simple income/monthly bill ratios, after they lose their job, which was a product of an overinflated market in the first place?
October 10th, 2008 at 3:33 pm
It’s the “don’t you feel stupid for selling” rally….
October 10th, 2008 at 3:35 pm
Dow just turned positive and a parade of optimists on CNBC. Maria Barforomo is smiling. Nothing has changed, status quo mentality prevails, plenty of selling opportunities remain.
This wasn’t a panic, it was a brief jolt of reality. I concede the possibility of a sucka’s rally.
By the way, the winner is:
Bullish signals when in two weeks we may have all 3 of the big three out of business…
Buggy whips, anyone?
Posted by: Bruce in Tennessee | Oct 10, 2008 2:38:29 PM
October 10th, 2008 at 3:38 pm
On second thought, I stupidly forgot that Barry’s posts have the power to move markets.
October 10th, 2008 at 3:38 pm
Holy crap, this is fun !!
October 10th, 2008 at 3:40 pm
The liquidity crisis is nearing its resolution, and that will provide a temporary respite, which should be used as a selling opportunity. When the recession is in full swing in 12 or 18 months and earnings have fallen off the cliff, the people who sold this week will look like geniuses. S&P 500 will fall below 500 at the real bottom.
October 10th, 2008 at 3:42 pm
Here comes the short squeeze….
Fuckers.
I’ve been waiting on my locked sell screen for 5 minutes now.
October 10th, 2008 at 3:48 pm
Rally won’t hold…too much damage has been done, but at least there will be less people throwing themselves in front of trains over the weekend.
October 10th, 2008 at 3:50 pm
PPT, just like yesterday, a late wet noodle push only to flop into the finish? no mo’ mojo?
October 10th, 2008 at 3:54 pm
So much toxic CDO junk is still left to unwind, but one wonders whether or not low-debt cashflow-positive firms not heavily exposed to the credit seize haven’t been oversold?
(In theory INTC is one, but I forget if they self-finance those multibillion dollar fabs… Just took a flier on SNHY, if demand for industrial products implodes that’s a big mistake, but otherwise they look clean…)
October 10th, 2008 at 3:54 pm
leftback:
You still getting in at 3.59 on this one?
October 10th, 2008 at 3:55 pm
Just another sucker’s rally. Remember when Fannie and Freddie rallied before being seized? Was there any rational reason for that? Nope. Just gamblers betting on the come.
8,000 triggered a wave of gamblers who want to believe we’ve found the bottom. The fact that people are talking about one day profits they made in the equities market tells you why our system is screwed.
Investment isn’t a six hour commitment. That’s a bet, nothing more. We’ve let gamblers turn our equity markets into casinos.
October 10th, 2008 at 3:56 pm
The other day, I started wondering how the longer term RSI looks on the DOW. Here’s a quarterly chart all the way back to 1971. We never fully corrected from the high-tech bust (which we knew with an artificial housing boom replacing the tech bust).
http://bigcharts.marketwatch.com/advchart/frames/frames.asp?symb=djia&time=20&freq=2
October 10th, 2008 at 3:57 pm
Looking at the S&P in the 1st chart looks like
a massive multi-year double top, and now are reaching support area from the 2002 lows, which may be a trading point for a bear market
rally as your other charts in the article point out BR.
Where’s the massive volume of panic selling?
Volume has been running visa WSJ Market Data
page for NYSE in the low 2 billions for the
high days which is no where record setting.
Great stuff as usual BR, along with your reality checks recently on the GSE vs wingnuts!
October 10th, 2008 at 3:59 pm
Ooops, the link was truncated. It should be “….=20&freq=2″
October 10th, 2008 at 4:00 pm
Looks like a last ditch effort to make this a positive day.
You can see the taxpayer $$ being diverted from Nassau to Wall Street, but is there enough fuel to feed this gluttonous tanker?
Did jump on the Magic Bush? Ouch.
October 10th, 2008 at 5:15 pm
are the Machines off, yet?
closed @ ~8451 v. DJIA?
wow, still off ~128..
think about this Spot Silver 10.16 v. retail U.S. Silver Eagle ~19
these are some different days…
nice time for a ~51 hour break, have a good one y’all..
October 10th, 2008 at 5:30 pm
Barry,
I am starting to think I remember you as a broker on the floor of the AMEX. NEVER COUNTER TREND TRADE!!!!!!!!!!!
October 10th, 2008 at 6:19 pm
Does anyone see the sequence that I see? We are going to be totally decimated from here – the appex was in 98. GAME OVER.
October 10th, 2008 at 6:31 pm
I am 50% agreed to bigpicture opinion that the market is now forming a bottom. But forming a bottom does not mean it has hit the bottom. Perhaps today Friday is the bottom….but no one knows. It is not certain. As such, I consider 50% chance for potential further decline of Dow and S&P Indexes to level that investors have never imagined: Dow below 7000 and S&P below 700 which appear more likely to be the bottom. Visit http://www.undervaluedsecurities.com !
October 10th, 2008 at 7:57 pm
by chance your not kramer or kudlow fron CNBC.If you have 100k in an account and over a year you lose 50% you are left with 50k.Now over the next year if you get 50% on your money you still have only 75K.A lot short of your 100K.For every dollar you lose you have to get 2 to get even.A FACT.Every argument you make for the market being oversold was an argument to get out on the way down>The talking heads on CNBC need your money so they can fly to the bahamas in the winter.Dont panic stay focused.Let me ask you who took this market down.Institutional investors who make up over 50-60% of the volume every day.Not 401k people.If the people who know got out why are u there.A fizzeled rally july-september was the key.23 days of the 48. in that time period were up days that went no where.Lets look at the nasdaq.The slogan in the late 90s.NASDAQ the stock market of the future//////////.Where is it today???????A high of 5142 in 200o and a high of 2861 in 07.Where did the tech market go.The internet bubble???????????.Only the dow made new highs over 2000.And thats because the exon drove it up.Only a handfull of dow stocks made new highs but because it is a weighted index the top caps count more.The SnP 500 struggled to get back to the 2000 highs.And the SnP 100 never got close.The top 100 stocks in this country faltered.The hand writing was on the wall.Wall street is a pozi scheme.It takes fresh blood to pay off the old blood.If it takes x amount of money to drive the dow from 10000 to 11000 x will not take it to 12000 because the priceof stocks are higher.The very tech anlaysis that u use now could have gotten u out.Get out on the way down and get in on the way up.Do you think this shit is honest.They areafter the credit bureaus because they are now downgrading these companies.They were afraid to do it for fear of a backlash from wall street.They need wall strret to go up so the rich dont have to fund our pensions.How many people here have 401ks that employers contribute to now.When they started out yes now no.Go to stock timing .comYou can get free emails and even spend a few bucks and subscribe to chenards newsletter and see what runs wall street.
October 10th, 2008 at 8:00 pm
These are interesting charts. However can we look at 1929 charts and compare them to today’s? I’m looking for the DOW to reach 4500 which will signal the start of the next depression.
October 10th, 2008 at 8:23 pm
For rds the crash of 29 was down 89% into the bottom of 32.It took until 54 to get back to where it was in 29.Go to buy-stocks-now at yahoo groups and i will send you charts and somewhat accurate opinons better than wall street.I listened to bllomberg at the close yesterday and a guest said the crash of 87 it came right back.Has japan ever recovered in the nikkei.Shangahi has lost 60% after a parabolic move.Sure its going to rally and come back down.What caused this is not over.What happens when we have a constant flood of bad earnings.wall street after lowering expectations will tell us its in line with expectations.The other day some stock rallied because it lost only 3 cents per share as oppsed to the expected 10.would u invest in a losing company.The biggest names have had 3 straight quaters of sliding earnings.Bank stocks topped out in early 07.As the banks go so go we and we aint going far.The lost money markets houses where will that replacemnt come from.people are losing their jobs left and right.And what happens this spring when companies cant pay off their debts.Very few companies have psoitive balance sheets.MSN oil companies//////Bank of america jsut sold 10 billion dollars of stock and just lost 3 dolars a share.This has diluted the value of the stock.And others are planning to sell more stock.common sense seems to be pervasive these days instead of the norm
October 10th, 2008 at 8:53 pm
Volatility. v-o-l-A-t-i-l-i-t-y.
October 10th, 2008 at 10:11 pm
Barry!
Hey…a couple months back I stated that we were going to earn AROUND $55 to $58 in 2009 on the S&P 500.
IF we hit those levels of earnings and STAY FLAT at those levels in 2010 then this looks like a decent entry point with 770 looking like a worst case scenario.
But that ASSUMES we hit $55 to $58 in 2009 WORST case and DO NOT WEAKEN THEREAFTER.
You have to wonder what earnings will look like for 2009.
If they are closer to $50 OR in the $40’s then ALL BETS ARE OFF and you can see 600 on the S&P 500 before you could say KUDLOW!
October 10th, 2008 at 10:37 pm
So easy to be a bear now. I covered wednesday, my bad. Fighting the G-8 could be tough. Hedge funds and individuals getting margin calls or just running for the hills. I know my companies, they’re the organizations behind those colored numbers on the screen. There are some deals there.
October 10th, 2008 at 10:46 pm
Well, there is no buyer for so long,
we’ve got to have some upside days.
Fears have been reigning for 2 weeks.
It is time for the intense emotion to recede.
How long have you kept an extraordinarily intense emotion
running ? 1, 3, 7, 14 days at the same strong intensity ???
We certainly have great herd mentality along with the cheering
media across the globe and on and on for 14 days!
Lucy
October 11th, 2008 at 12:59 am
Interesting and somewhat predictable day…
24 hours ago we suggested that shorts cover on the open…that we could see a 10-15% rally. From the lows we saw two different 10% rallies. Yowsa!
The Elliot Wave Analysis as been accurate ALL YEAR LONG. We’ve been calling for a crash into the end of the year.
I believe we saw today (and this week) the most oversold condition we will see for the rest of this bear market. Today we probably saw the completion of a third wave within a third wave within the larger Third Wave…pretty much as extreme as it gets in EW parlance.
The models all suggest two more decent mini-crashes before we can stage a good seasonal rally into May-June next year. These will only seem “mini” in nature because of what we’ve just experienced the last several days.
At this point we’re dealing with third wave “extensions” and its difficult to pin down exactly where we will ultimately “finish” the larger Third Wave….I’m guessing around 775 ish…for a “percieved” double bottom against 2003, but don’t fool yourselves.
Today WAS NOT the bottom. And I don’t think the “double bottom” against 2003 will hold either.
I’m hoping we see some more bear market corrective action towards the 1000 level next week…will be a terrific selling opportunity. I’m short SP500 calls with this Volatility……and I’m praying for a rally to sell.
- AT.
October 11th, 2008 at 1:02 am
Dipping in now may make sense, technically, but I question whether it is fundamentally sound.
The G7 meeting today didn’t produce the desired substantive wording. Weak, in my opinion.
Nothing has yet helped to clear up the log-jam. We’re still in a very serious bind.
There are so many shoes that could drop almost simultaneously (and some which are poised to cause cascading reactions) and at any time now, it seems too risky to me to jump in with as much as 10%.
Folks, consider what happens if things continue to lock up (and they are). Even overnight lending is now looking shaky. There will be no payrolls. There will be no product shipments. Tell me, what will happen to company profits if that happens, and how on Earth could that possibly justify dipping in at these levels? Yes, they are attractive. But if you dip in now, doesn’t that mean that you are assuming the world will return to normality within a week or two (so that there are no serious lost profits from supply disruptions)? I honestly can’t see how this could end that quickly.
Confidence, like trust, is easily lost and difficult to gain. And when you’re dealing with an entire GLOBAL economy with so many differed and varying institutions governed by so many differed and varying juridictions, I can’t even begin to conceive how this crisis of confidence can be healed in just a few short weeks. Perhaps a few months… but not weeks.
And if months is the correct time-frame, many of those stocks that you are dipping into now may be worth-less (read it any way you want) by the time the supply disruptions that are probably almost inevitable at this stage, are resolved.
The stock market is heading lower, I’m afraid. Probably much lower in undershoot territory. It’s going to take years for companies to become as profitable as they were. Buyer beware!
October 11th, 2008 at 1:10 am
Random note on J. Cramer….
In the past this guy has been a cheerleader and he’s made some silly calls. But, I have to give him some props lately…he’s corrected himself and has guided longer term investors in a generally correct direction.
He’s definitely a momentum type of trader…but in his heart and mind he’s still a ‘trader’ and real traders know how to BUY and SELL markets the same way. He clearly realizes we’re in a vicious bear market.
Would love to bash the guy because of some of his “bottom calls”….but he’s been generally correct the last several weeks during a very bad time.
The trait of any good trader is to have a flexible mind and recognize when you’re wrong.
- AT
October 11th, 2008 at 1:59 am
http://www.telegraph.co.uk/finance/financetopics/financialcrisis/3174217/Financial-crisis-Countries-at-risk-of-bankruptcy-from-Pakistan-to-Baltics.html
Problem in your analysis is that we are now global. And Iceland, Pakistan, Ukraine, Argentina, Hungary, are all going bankrupt soon. If these sensitive hot spots implode, you can kiss your charts goodbye for a while.
And just to make it interesting, the US states are all going begging to DC asking for dole…
No, we have not yet hit bottom. Kind of like the movie Abyss…
October 11th, 2008 at 3:46 am
I expect a psychological rally up to 10,000 on the DJIA by mid-January. Once people realize that Paulson is just a Houdini (trying to save failed banks with borrowed money), and once unemployment spirals out of control as businesses who can’t get working capital fall like dominoes, look for DJIA to fall to 2,000. Note, in 1929-30, the DJIA did exactly this, and the bottom was 1/9th of the top.
October 11th, 2008 at 3:48 am
@ Dan Duncan | Oct 10, 2008 2:01:49 PM
I was tempted to go long until I read the posts of those…who are already going long.
Waayyy too clever. This market’s all about punishing those who think they are smarter than everyone else….from the quants all the way down to the types who go long, because Cramer said to sell…or knock the “average investor” or the “MSM types”….
This market’s all about pile driving The Too Clever Trader.
Dan,
Trading the market is all about probabilities and how best to capitalize on them. I think Barry laid out a pretty good case as to why it is a good time to start looking again. I did some buying today but I have a 20 year time horizon for when I plan to sell those shares so I can afford to be a little wrong on my timing. You may say that the world is going to end and so is my job and you may be right. That is about the only thing that would make my trade today bad. If that happens though I will have a lot more to worry about than money.
If the market tumbles more from here then my job will buy me more shares and the dividend yield I will be getting will be even higher than the one I bought today. Where do you suggest I put my money….in a bank?(I think that will be the new joke going forward)
It is all about probabilities and the lower the market drops the higher the probabilities that the market will soon reverse and turn these buys into positive gains
October 11th, 2008 at 3:53 am
I think we should play the trends. Fading Bush seems to be the best money trend going. Six months ago he said everything was fine and the world went into the tank. Now he says we are on the brink of oblivion.
I think the trend is your friend here folks (:
I’m just joking of course. Use extreme caution here. Our faithful ‘leaders’ have walked us into a minefield. Just remember, it is YOUR leg.
October 11th, 2008 at 5:39 am
Just remember that the stock market was up over 400% in 8 years. The us markets were only up approx. 100% in 5 years of bull market. That’s why the 1929 crash was worse.
~~~
BR: The Dow was down over 80% in 1929-33. Thats why 29 was worse.
October 11th, 2008 at 11:10 am
It’s hard to believe, a bull sign?
Maybe if the Gov wants to bail out CDS from Lehmann….
October 11th, 2008 at 11:11 am
It’s hard to believe, a bull sign?
Maybe if the Gov wants to bail out CDS from Lehmann….
October 11th, 2008 at 12:21 pm
Barry, i agree, the only problem is that there is a space for a real nuclear deleveraging scenario, like we saw in Russian equity market. Visious sell-off, market down allmost 80% to the low and only one meaningfull bounce, which lasted one day.
The reason was that many businessmen pledged equity in their companies as collaterall for the loans thay took to invest in some other business and there unable to meet margin calls due to credit crunch.
So a new category of players emerged – banks who do not give a shit about the level of the market, they just dump the collaterall.
I do not know if you have this kind of leverage an loans in US, but it’s is true that more advanced economies have higher leverage. So let’s hope this will not get to extreeme.
October 11th, 2008 at 2:00 pm
It would be interesting to see parallel charts of margin and stock market capitilization. I don’t think that cash tells the whole story in a mega-leveraged market.
October 11th, 2008 at 2:55 pm
Andy Tabbo @ 1:10:15 AM
You’re too generous. For Cramer, it’s too little, too late.
October 12th, 2008 at 6:48 am
I am looking at a logarithmic chart of the inflation-adjusted S&P 500 index for the years 1945 to now. On this chart, one can draw an upward sloping trendline using the points for the index in January 1995 (when the bull market of the 1990s began) and the bear market low of October 2002, During the entire period from January 1995 to late September 2008, the index was always above this defining trendline.
This important trendline was definitively broken when the S&P 500 broke below 1200, and after that the market started plummeting. The inflation-adjusted index is now 25% below that trendline.
The inflation-adjusted index is also now 4% below the inflation-adjusted value that it had at the bear market bottom of October 2002.
For a chartist, these are very worrisome findings. On the chart the next place where there is price support (i.e., an area on the chart where the market spent a lot of time) is at the inflation-adjusted value for January 1995. The inflation-adjusted value for this area of support is 690 +/- 30 (i.e. 660 to 720). On an inflation-adjusted chart, there is no area of support between the current value and the January 1995 inflation-adjusted value.
This suggests to me that the index will eventually fall to an inflation-adjusted value of 690 +/- 30. It can do this by falling, being eaten up by inflation, or some combination of the two. If it does fall to that inflation-adjusted level, it can occur over a period ranging from days to years.
To reach 690, the inflation-adjusted S&P 500 will have to decrease 23% below its current value of 899.
October 12th, 2008 at 9:37 pm
financialtraders blog also posted a called for the bottom and end of market crash on Friday noon times as well.
At 1:49PM blogger called for the buying. Sometime later fireworks!
Article title and URL are:
“Stock Market Crash 2008 Ended Today 10-10-2008: Back to normal trading (We are at lunch time now on 10-10-2008″
http://financialtraders.blogspot.com/2008/10/stock-market-crash-2008-ended-today.html
October 13th, 2008 at 2:44 am
AIG Knew of Possible Problems with CDS (credit derivative swaps)
http://marketwarnings.blogspot.com/2008/10/aig-knew-of-possible-problems-with-cds.html
October 13th, 2008 at 6:28 am
The stock market crashed last week.
Despite the many media comparisons to 1929, the present environment is entirely different now. The existence of G-7 central banks and the logical expectation of concerted actions, repeatedly if necessary, presents an entirely different environment than the stock market crash that led to the Great Depression.
Unfortunately, there are never any guarantees. In retrospect, the decision to allow Lehman Brothers to fail set off a chain of events that led us to the precipice. More mistakes may be made. Clearly, even the best outcome is going to require a very long time and things won’t quite ever be the same. The most acute caveat is that the derivative time bomb is still ticking, even after the damage wrought in recent weeks. “The Great Unwinding” we warned of in our January ‘08 Pictures Of A Stock Market Mania update (see http://www.cross-currents.net/archives/jan08.htm) continues and the secular bear market will likely persist for another two years.
However, there are signs that a powerful bear market bounce is likely to commence, perhaps as soon as Monday. Everywhere we look, we see indicators as oversold as we have ever seen and sentiment measures are indicating extreme fear. While bear market rallies can be very powerful, what occurred intraday on Friday was extraordinary. At one point, the Dow had gained 860 points (10.7%) in only 40 minutes. While we can make the case for frantic short covering, Dow 8000 presents a wholly different valuation picture than Dow 11,000. We are beginning to see some solid valuations amongst individual stock issues.
At this point, our most likely scenario is a very short term move to the upside before a retest of last week’s low later this month. At Monday’s average price for the first half hour of trading, we will initiate Microsoft Corp. (MSFT) as a 10% long “idea” in the Trading Stance feature, with a $2 “stop.” It is entirely possible we will close MSFT out before the end of the week.