Mike Panzner writes:
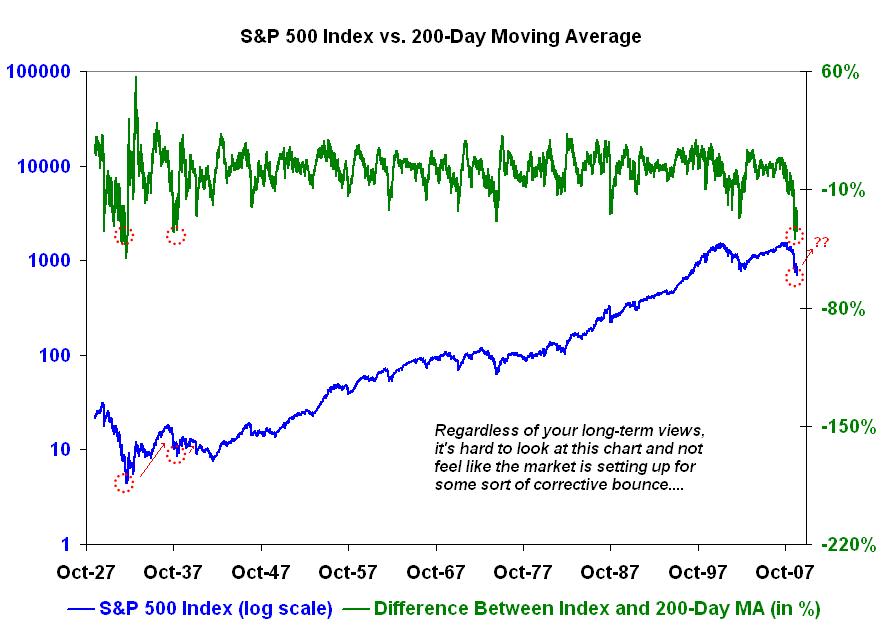
Regardless of your long-term views (mine, as it happens, are bearish), it’s hard to look at the accompanying chart and not feel like the market is setting up for some sort of corrective bounce.
As of now, the S&P 500 index is about 35% below it’s 200-day moving average, which is not far below the one-day gap of 39.65% seen on November 20th — just before the market staged a 5-day, 19% rally — as well as the record differentials hit during the Great Depression, which also proceeded powerful upside reversals.


What's been said:
Discussions found on the web: