Bailout Costs vs Big Historical Events
It is exceedingly difficult to convey exactly how much we are spending on all these bailouts. Whenever I start talking trillions (versus mere billions), I get puzzled looks from people. Humans have a hard time conceptualizing any number that large. I wanted a graphic way to clearly show how astonishingly ginormous the amounts involved were.
So I once again went to Jess Bachman at Wallstats. I gave him my list of expenditures (inflation adjusted of course!) and he went to work. This early Bailout Nation graphic shows the the total costs to the taxpayer of all the monies spent, lent, consumed, borrowed, printed, guaranteed, assumed or otherwise committed.
It is nothing short of astonishing.
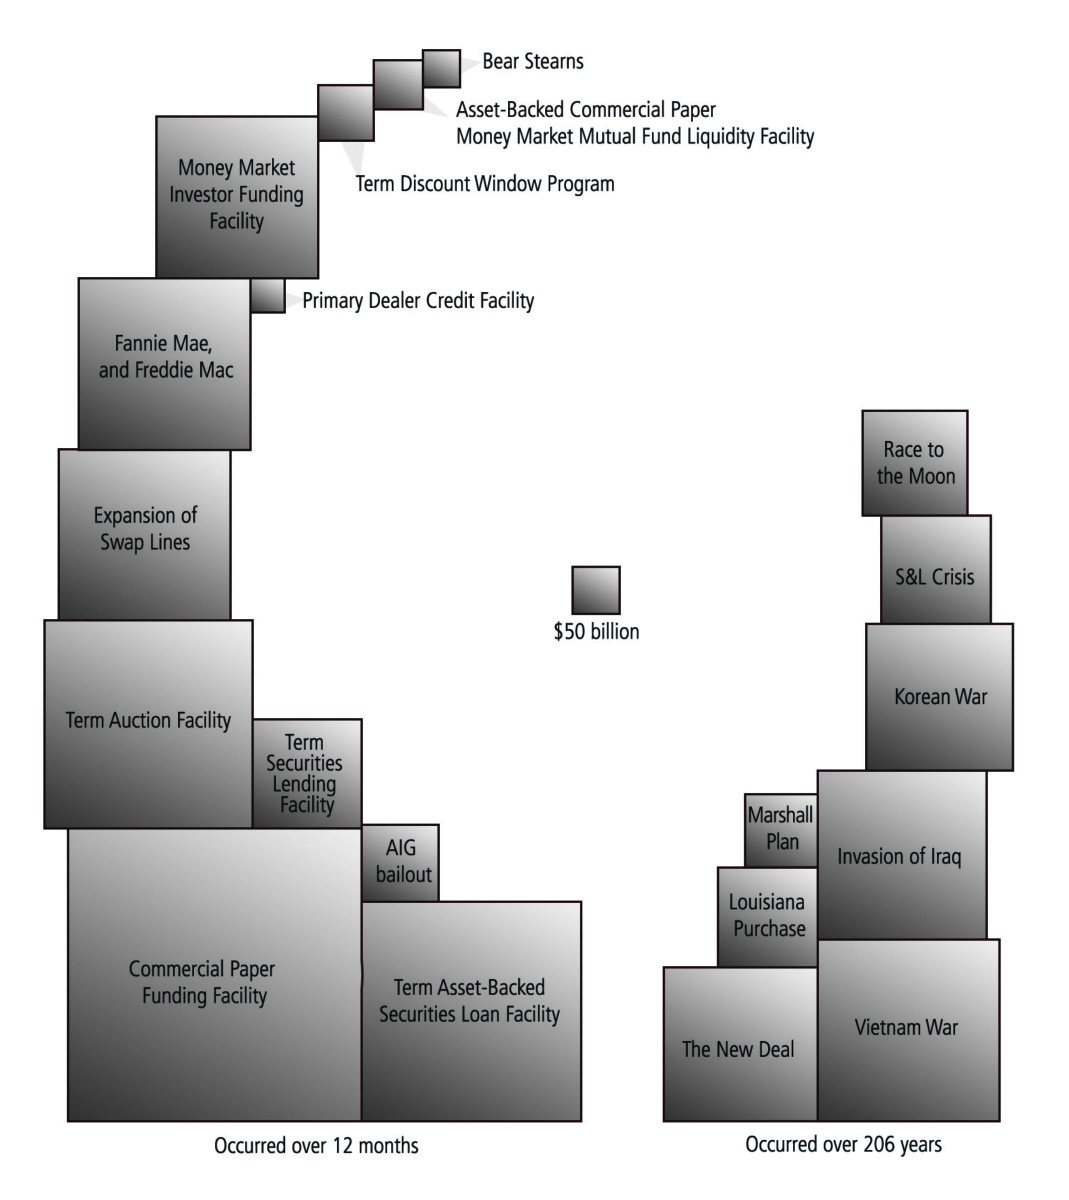
It includes the total outlay for all the bailouts to date. In just about one short year (March 2008 - March 2009), the bailouts managed to spend far in excess of nearly every major one time expenditure of the USA, including WW1&2 (omitted from graphic), the moon shot, the New Deal, total NASA budgets (omitted from graphic), Iraq, Viet Nam and Korean wars — COMBINED.
206 years versus 12 months. Total cost: ~$15 trillion and counting . . .
>
>
Note: This was finished too late to make it into the hard cover edition of Bailout Nation, but it will be in next year’s paperback, and whenever the Kindle version finally shows up.
>
Previously:
Big Bailouts, Bigger Bucks (November 25th, 2008)
http://www.ritholtz.com/blog/2008/11/big-bailouts-bigger-bucks/
Bailout Nation: How Greed and Easy Money Corrupted Wall Street and Shook the World Economy
Wiley (May 26, 2009)
http://www.amazon.com/exec/obidos/ASIN/0470520388/thebigpictu09-20


June 17th, 2009 at 10:54 pm
For those of you too lazy to click thru to the older post about the dollar amount:
• Marshall Plan: Cost: $12.7 billion, Inflation Adjusted Cost: $115.3 billion
• Louisiana Purchase: Cost: $15 million, Inflation Adjusted Cost: $217 billion
• Race to the Moon: Cost: $36.4 billion, Inflation Adjusted Cost: $237 billion
• S&L Crisis: Cost: $153 billion, Inflation Adjusted Cost: $256 billion
• Korean War: Cost: $54 billion, Inflation Adjusted Cost: $454 billion
• The New Deal: Cost: $32 billion (Est), Inflation Adjusted Cost: $500 billion (Est)
• Invasion of Iraq: Cost: $551b, Inflation Adjusted Cost: $597 billion
• Vietnam War: Cost: $111 billion, Inflation Adjusted Cost: $698 billion
• NASA: Cost: $416.7 billion, Inflation Adjusted Cost: $851.2 billion
TOTAL: $3.92 trillion
http://www.ritholtz.com/blog/2008/11/big-bailouts-bigger-bucks/
June 18th, 2009 at 7:16 am
people get used to large numbers pretty fast. Just last spring, $500B seemed like a big number. Now it’s part of every day calculations. Next up, quadrillions…
I bet the Zimbabweans are experts at big numbers.
June 18th, 2009 at 7:27 am
You forgot to mention that the past operations were substantially financed with debt.
Many of the current ones are clearly financed with electrons only, while the debt actually created will likely be financed with inflation far down the road.
Hope this helps.
~~~
BR: Much of this is real debt — anything the Treasury disburses, along with much of the Fed actions (Repos, capital injections, lending against all assets, toxic or otherwise)
Some of it is “electrons” but they have an impact too.
June 18th, 2009 at 7:31 am
Your forgot the conspiracy nut (me included) secret Fed program to filter electron money to iBanks for the financial program intended to raise the stock market high enough to finance new bank issues.
June 18th, 2009 at 7:40 am
Isn’t the AIG bailout up to $160B-plus?
~~~
BR: $178B and counting
June 18th, 2009 at 7:43 am
Definitely a good visual. Nice work Jess Bachman.
June 18th, 2009 at 7:58 am
Is this in constant dollars, or historical dollars? If the latter, then (as someone pointed out on Boing Boing) the Louisiana Purchase was pretty darned pricey!
June 18th, 2009 at 7:59 am
Oops, NM. Just noticed the post above that says “inflation adjusted”.
June 18th, 2009 at 8:03 am
The text of the posting says WW2 is included, but it doesn’t appear on the graphic.
June 18th, 2009 at 8:03 am
Does anyone doubt the dollar will be devalued – either formally or more likely thru hyperinflation.Formal devaluation requires someone to accept responsibility while hyperinflation can be blamed as a mystery cause, beyond human control.
The next generation is screwed, a large portion of their tax dollars (fed & state) will be spent carrying the national debt incurred to keep democracy safe for bankers. Private pensions are history, 401Ks ditto, Soc Sec will be tapped out.We’ll have national health care that will be decent, I’m sure the mega buck bankers will include solid gold health plans for themselves thru future bank lobbying successes.
June 18th, 2009 at 8:05 am
At $600B the Iraq invasion has to be the biggest waste of taxpayers dollars prior to Sept 08. Iraq ain’t over yet either.
June 18th, 2009 at 8:09 am
[...] Link: Bailout Costs vs Big Historical Events [...]
June 18th, 2009 at 8:10 am
Sad that the Obama admin is like Bush’s 3rd term.
What if Bush hadn’t been pressured into bailing out GM & Chrysler? All that money we’ve poured into them just to delay the start of their bankruptcies by a few months with the meter still running.
I see the auto parts makers won’t get any more funding to stave off their bankruptcies. Every deal is different.
I think at this point Team O’B is operating in fear of US losing AAA rating
June 18th, 2009 at 8:13 am
Having repaid the TARP the banks are negotiating repayment of the warrants, I sure Turbo Timmy will be gentle with them. Lets all say a prayer of thanks that Turbo’s Toxic asset plan didn’t get off the ground, the taxpayers wouldn’t have even gotten vaseline with that screwing
June 18th, 2009 at 8:29 am
Barry, what happens when you look at those costs as a percentage of GDP at the time when they were incurred?
June 18th, 2009 at 8:29 am
What about WWI and II???
June 18th, 2009 at 8:45 am
[...] Barry Ritholz’s article on the bail-out. However, Barry estimates the cost of the bail-out at $15 trillion, but this NY Times article [...]
June 18th, 2009 at 8:52 am
The late Nobel laureate physicist Richard Feynman on large numbers:
“There are 10^11 stars in the galaxy. That used to be a huge number. But it’s only a hundred billion. It’s less than the national deficit! We used to call them astronomical numbers. Now we should call them economical numbers.”
— Richard P. Feynman
June 18th, 2009 at 8:54 am
The graphic should clearly state “inflation adjusted costs” or most sensible people would simplydismiss it. Also, while omitting the War of 1812 and the Invasion of Granada is probably permissible, a flagrant omission is the military and civilian cost of the Civil War.
June 18th, 2009 at 9:01 am
Good graphic and vivid illustration of “This will not end well.”
June 18th, 2009 at 9:12 am
@ aitrader & MEH
Just curious what your time zones are. as your posts are time-stamped @ 9:01 a.am and 9:32 a.m. and here in Ohio as i post this it is only 9:10 a.m. EDT. Are you guys in the Twilight Zone?
June 18th, 2009 at 9:13 am
OT here. Yesterday I posted a quote from Mish regarding the CRA. I was away most of the day & read the comments this AM to catch up. I said the comment was a doozy & I meant it in a sarcastic way. BR has proven over & over again the canard of CRA and their supposed culpability in the mortgage mess. Going to have to watch my posts in the future to make sure I make my views clearer.
June 18th, 2009 at 9:13 am
BR added :
~~~
BR: Much of this is real debt — anything the Treasury disburses, along with much of the Fed actions (Repos, capital injections, lending against all assets, toxic or otherwise)
comment:
————–
Something is missing in the translation.
For example, TARP is debt financed and documented here. http://seekingalpha.com/article/142571-tracking-tarp-funds.
With respect to the Fed, you are saying that many of it’s cash for trash programs are debt financed. While this may be true, in order for this to happen, using Open Market Operations the Fed would have to sell massive amounts of debt it had previously purchased. The cash would then be loaned out with toxic assets as security. I can’t recite the litany of programs available or in actual use, and frankly, I haven’t followed them much. But I get the impression this hasn’t happened to any large degree and the Fed programs are basically electron money.
The only reason inflation hasn’t soared is that we are in a liquidity trap at the moment. My impression is that the Fed hopes electron money can be recovered over time after the toxic assets are cleansed in some method, thus preventing Phillips curve type inflation (the only kind they seem to be able to see)
While I remember you dislike homework assignments, I couldn’t find out much detail about this to support or refute my opinion. Where is more detail available?
~~~
BR: And Debt financing isn’t real money?
June 18th, 2009 at 9:19 am
I agree with the folk who are dissatisfied with the omissions in the 206 year pile. Maybe the pile should be renamed as “Sample historical expenses”.
If not, then a _real_ complete 206 year pile HAS to include WWI and WWII and a block for the cold war, call it “Nuclear Deterrent Deployment and Ops”. National Interstate Highway system should be in there as well.
I agree strongly with Hume. A chart that had all those expenditures and related them to the GDP at the time would make me wet my pants! I’d buy at least two copies of a poster version.
June 18th, 2009 at 9:26 am
BR your title is terribly misleading. Those are not the Bailout “Costs” that is the Bailout Scope. In order for it to be a cost you would have to assume the Fed will have a 100% loss rate on all of that commercial paper and other assets that will likely have very low loss rates. I think you know that there is a big difference between an investment in commercial paper or other loan facilities (when you expect to recoup the majority of your investment with interest) and an expense such as war when there is zero chance of seeing that money again. This graphic is hyperbole that may be good for selling books but I think it is a meaningless comparison.
June 18th, 2009 at 9:28 am
I said:
While I remember you dislike homework assignments, I couldn’t find out much detail about this to support or refute my opinion. Where is more detail available?
more:
————-
Or is it possible I accidentally stumbled into the Fed event horizon, and all that remains is the black hole? Did I just describe why the Fed needs to be audited?
June 18th, 2009 at 9:32 am
Advertising:
Edward Tufte is holding a series of One-Day Courses in Philadelphia and NYC.
July 28(PHL), 30 y 31(NYC)
http://www.tufte.com for more info..
June 18th, 2009 at 9:35 am
R. Timm Says:
June 18th, 2009 at 9:26 am
This graphic is hyperbole that may be good for selling books but I think it is a meaningless comparison.
reply:
—————-
I disagree. This is a comparison of magnitude vs purpose. Also, many loans will never be repaid and the asset being securitized will never be worth the original price or anything close.
June 18th, 2009 at 9:38 am
Hi Barry
Hello from a fellow Wiley author…
I have a quibble with this post: you speak of concern with “…how much we are spending” and “…total costs to taxpayers” yet no distinction is made between actual spending and money that is lent that has a high rate of repayment.
It’s highly misleading and wrong to say: “Total cost: ~$15 trillion and counting . . .”
Good luck with your book – your PR folks are doing their job – I’ve been sent two copies to review!
Eric Tyson
Syndicated Columnist
Best-selling author of Personal Finance for Dummies
~~~
BR: As the text suggests (and I have explained elsewhere ad nauseum), this is not the total out of pocket expenditures of the bailout. It represents “monies spent, lent, consumed, borrowed, printed, guaranteed, assumed or otherwise committed”
For example, the 5.5 trillion in Fannie/Freddie mortgages are likely to return at least 95% of exposure.
June 18th, 2009 at 9:39 am
I’ve got to jump on the bandwagon with jc, here. Please forgive my politicization of this graphic, but I just can’t look at it without commenting on the complete lack of integrity of our government and its henchman, the MSM.
Iraq was supposed to cost us nothing. Zip. Zilch. Nada. Any person with half a brain and a modicum of integrity knows that there’s no such thing a a free war, yet we had all of “the powers that be” telling us that it would pay for itself.
Now we have made this cost look miniscule by bailing out (and I use that term as a Bail Bondsman would) the criminals on Wall St.
I want heads on pikes.
June 18th, 2009 at 9:43 am
EricTyson:
So, Eric, why don’t you set us straight. Your “credentials” won’t carry you in this forum. Please explain how we will recoup all of the money this nation has lost on the RE bubble and the subsequent fallout.
June 18th, 2009 at 9:45 am
To be fair WWII is not on the list.
June 18th, 2009 at 9:47 am
Marcus Aurelius Says:
June 18th, 2009 at 9:43 am
EricTyson:
So, Eric, why don’t you set us straight. Your “credentials” won’t carry you in this forum. Please explain how we will recoup all of the money this nation has lost on the RE bubble and the subsequent fallout.
comment:
—————
Add me to the list. Re your personal finance; did you possibly suggest the stock market or real estate were good ideas a few years ago?
June 18th, 2009 at 9:47 am
Same goes for you, R. Timm. Please explain how we will be repaid (with a healthy ROI, no less) with money that does not exist.
June 18th, 2009 at 9:50 am
EricTyson,
I just looked at your site. You make Larry Kudlow look like a dour suicidal permagloomer in comparison. I now understand your confusion.
June 18th, 2009 at 9:57 am
Helloooooooooooooooooo, Eric!
Where are you, man?
I forgot to ask: by the phrase, “. . . money that is lent that has a high rate of repayment,” do you mean the money we are borrowing from China and our other creditors to pay for this fiasco?
June 18th, 2009 at 10:00 am
As others have noted, it is not exactly illuminating to compare lending to spending. Many of the current programs are lending, and while they will experience some writeoffs, some of the money will be recovered.
And more importantly, we need to add per capita context to the numbers. The Federal Government is, after all, funded by the economic activity/tax proceeds of a nation, i.e. a sum of people. That sum of people is currently 300 million, which is 100x larger than the nation that signed the Louisiana Purchase. Which would put the LP at about a $21 trillion expenditure, comparing apples-apples.
June 18th, 2009 at 10:02 am
Wow, tough crowd at TBP this morning (albeit very good points). And I thought I was perpetually cranky.
June 18th, 2009 at 10:06 am
so….
Hey Ben, et al.
my faz shares were showing a glimmer of life yesterday. There was a TechTicker video or two that might have given some fuel to the bear viewpoint. Income, based on employment tax remittance is down 5% yoy. (green shoots, ha ha)
I’m still looking at the 50day MA and in many cases, we’re still in a short term up market. Still waiting for the blowup.
still.
waiting.
cjc
June 18th, 2009 at 10:08 am
E Says:
June 18th, 2009 at 10:00 am
As others have noted, it is not exactly illuminating to compare lending to spending. Many of the current programs are lending, and while they will experience some writeoffs, some of the money will be recovered.
comment:
——————–
Money being used to bail out miscreants is money that isn’t being used to fund productive investment. Thus, economically speaking, the opportunity cost of these programs, repayment or not, is astronomically high. These losses will never be recovered. You may have noticed the recession around us at this time. The two are related.
June 18th, 2009 at 10:08 am
E Says:
“As others have noted, it is not exactly illuminating to compare lending to spending.”
___________________
If you’re talking mortgages, it’s fair (the lending was spending). Why not now? You really think this money will be repaid?
As for the Louisiana Purchase, I believe we ended up with some prime RE holdings as a result of that deal (income-generating RE, I might add). What do we get for these bail outs?
June 18th, 2009 at 10:10 am
The only reason inflation hasn’t soared is that we are in a liquidity trap at the moment. My impression is that the Fed hopes electron money can be recovered over time after the toxic assets are cleansed in some method, thus preventing Phillips curve type inflation (the only kind they seem to be able to see)
—————
The Fed took bad loans off the banks’ books and gave them freshly printed dollars. They have not been written off, the loans are still there. Are they now using these dollars to bet on commodities?
We are expecting the government to generate a 1.5-2 trillion dollar deficit. This is financed by debt. The Fed is actually buying treasuries to keep rates as low as possible. This is money injection via debt.
Money basically has 2 places to go to:
1. assets
2. goods and services
You might not see inflation in your daily basket of goods because of the inventory liquidation but there is inflation in
1. Real estate: If the Fed had not intervened, I’m 100% sure that prices would be lower.
2. Commodities: Look at the price of oil since the Fed has been intervening. With a hands off approach, I’m 100% sure that commodities would not have bounced back so fast.
3. Bonds: With the Fed’s intervention in the markets, it has boosted bond valuations. That’s inflation because without this intervention bond valuations would not have gone so high.
4. Equities have increased by what, 30% thanks to the Fed intervention? That’s inflation.
5. The Cdn dollar has gone from 63 cents to 92 cents vs. the US dollar since the debacle. Our purchasing power has increased by at least 40%. At one point, your imports will get costlier.
Most exporting countries have seen their currency increase vs. the US dollar. This is forcing them to print to devalue their currency vs. the US dollar. That will generate inflation.
So unless you start producing your own goods, you’ll be importing inflation. Chances are you’ll increase your protectionist measures to rebuilt your manufacturing base but that will surely generate inflation.
June 18th, 2009 at 10:12 am
I’m not going to argue with anyone that the “value” of this lending/spending is horrific. The Louisiana Purchase was a fantastic investment in the future, while this current stuff is a bailout of the past. Just want to make the point that the total dollar numbers are hard to really nail down when some of the boxes consist of Term Auction Facilities and the like.
June 18th, 2009 at 10:14 am
Marcus
You say: “Please explain how we will recoup all of the money this nation has lost on the RE bubble and the subsequent fallout.”
You’re missing my point. Clearly, many folks lost money just as folks lost money when stocks and real estate got hammered in the early 90s, early 80s, mid 70s, etc. That happens in any recession/severe downturn. And “the nation” hasn’t lost money – various individuals have. Some more than others. Those who did the worst in real estate in recent years didn’t run the numbers on properties they bought and do a simple rent versus buy comparison that is presented in Home Buying for Dummies. I know plenty of long-term real estate investors who are doing just fine.
Mann: Yes, this is a testorone filled cranky crowd but the bad NY weather today may account for some of that…
Dead Hobo: “This is a comparison of magnitude vs purpose. Also, many loans will never be repaid and the asset being securitized will never be worth the original price or anything close.”
Why don’t you run us through your analysis of the boxes in the graphic old wise one…how about starting with the three biggest boxes in the lower left of the graphic – what portion of that money do you believe is/will be lost?
June 18th, 2009 at 10:15 am
Fiat currency only works one way, and that is by inflation. The government might choke the life out of the citizenry by sequestering the inflated currency (faux deflation), but in the end, inflation is the only tool they have.
June 18th, 2009 at 10:15 am
You are comparing apples to oranges. Loans and loan guarantees are not costs, some of them are not even layouts. It is actually possible that some of them may end up costing absolutely nothing or turning a profit (although that is not very likely). The least you can do is to give those squares a different color.
June 18th, 2009 at 10:17 am
[...] chart showing the level of spending in the last 12 months compared to the spending over the last 206 years in inflation adjusted [...]
June 18th, 2009 at 10:20 am
What you are really showing is that government had to come and take over and fix things, where capitalism and market forces so miserably had failed. None of my commerades are surprised. Free marked capitalism is a failed experiment, so what is new
.
June 18th, 2009 at 10:21 am
more off topic.
so the tech ticker video is very stodgy and almost dreary. Ideas put forth with numerical research behind them. Then, in the middle, there is a spot of an ad for fox business news. and I laughed b/c as a male, I just saw boobs.
Which reminds me that minyanville had a hoofy and boo segment recently where they dressed up as girls to keep up with the likes of Erin etc.
So the real point is that the numbers and serious research, sans flashy graphics, seem to have led this man and his company to making money. (Charles Biderman, CEO of TrimTabs Investment Research)
“Massive Insider Selling”: Pure Supply and Demand Makes a Bears’ Case is the second video. Interesting view on the market.
So, this is a media comment to Barry. I think this guy made more correct calls than all the ladies on CNBC combined over the last decade. However, I don’t see how you could tart this guy up to succeed on TV. (caveat — I don’t watch finTV. and I didn’t know the host of Fox BNews looked like that, hence my surprise.)
June 18th, 2009 at 10:24 am
Loans and loan guarantees are not costs
——————-
They are costs, opportunity costs.
If it weren’t for guarantees, the bad businesses would stop eating the good businesses lunch. They’d die and maybe leave more room for healthy businessess that don’t need prop ups.
June 18th, 2009 at 10:25 am
Free marked capitalism is a failed experiment, so what is new
.
———–
We never had free market capitalism. I don’t understand why so many are so blind to this fact.
June 18th, 2009 at 10:26 am
EricTyson Says:
June 18th, 2009 at 10:14 am
Dead Hobo: “This is a comparison of magnitude vs purpose. Also, many loans will never be repaid and the asset being securitized will never be worth the original price or anything close.”
Why don’t you run us through your analysis of the boxes in the graphic old wise one…how about starting with the three biggest boxes in the lower left of the graphic – what portion of that money do you believe is/will be lost?
reply:
—————
You continue to ignore the fact these programs exist in the first place and why they exist. You ignore the effects on the world economy due to the fact these programs are necessary. You continue to ignore crowding out. You ignore magnitude by assuming their purpose is less noble than the historical ones. You ignore low asset quality. You ignore rebuilding asset inflation in commodities and probably stock markets due to too much money with little else to do, all of which came from these idiotic programs. Rather, you would play the distraction game by demanding I explain some detail that misses the overall point (Isn’t that a part of Rush’s ‘How to Argue with a liberal’ technique. Distract, demand absolute proof, repeat, never explain yourself, then walk away)
June 18th, 2009 at 10:27 am
@batmando
I’m on Central European Time, which is GMT +1.
June 18th, 2009 at 10:32 am
Hobo: I don’t listen to Rush and have no idea how he argues. I asked you a simple question about the biggest lending facilities on the chart and you raise myriad issues I’m supposedly ignoring. How would you possible know what I believe and ignore?! Good luck to you – you’re not open to a real debate either because you are sure you are right and/or you can’t answer simple questions to back up your bold sweeping generalizations.
June 18th, 2009 at 10:32 am
EricTyson:
This ain’t the early 90s, early 80s, mid 70s, etc. This is 1931, or worse. We are a nation of fiat currency, as such, the argument can be made that we never will “lose money,” (“money’ being the loosest of concepts).
Will your next observation be that the nation didn’t “lose” money during the GD?
The losses you cite, from the early 90s, early 80s, mid 70s, etc., were rolled over into new debt and applied to the blowing of new bubbles. We are at peak credit. There will be no new bubbles blown this time.
This is a fact: we are in debt up to our eyeballs, and that debt grows every day. At the same time, GDP, revenues, and earnings are down. In fact, it is very reasonable to assume that we are bankrupt as a nation (both publicly and privately).
To answer the question you asked DH, we will lose all of it. If you think we won’t, please explain the credit/cash ratio (that is, please explain how credit extended (debt) is not “money”, and where the “money” will come from to pay that debt), and exactly how we will pay ourselves back with money that we don’t have.
Perpetual debt is equivalent to perpetual motion.
June 18th, 2009 at 10:34 am
EricTyson Says:
June 18th, 2009 at 10:32 am
you’re not open to a real debate either because you are sure you are right and/or you can’t answer simple questions to back up your bold sweeping generalizations.
reply:
————
You first. Tell me, in detail and supported by known facts, why I’m wrong on those points you asked about.
June 18th, 2009 at 10:37 am
I hate to against my crowd of friends on this one, but the chap Eric Tyson does raise a valid point in calling the boxes on the left “Cost.” Some of the funds cited in those boxes are “loans” to financial institutions that will be paid back. That stated, there will be a decent % that will never be paid back. The dollars sunk into AIG/Freddie/Fannie….those dollars aren’t coming back. That was money wasted on non-performing assets like McMansions in Exurbia.
Instead of calling those big boxes “Cost,” I would refer to them as “Poor ways of tying up huge capital.” It would have been better to set up a Debtor in Possession fund and allowed the creative destruction forces of capitalism work their magic on the banking sector….
June 18th, 2009 at 10:37 am
EricTyson,
You’ve been served.
June 18th, 2009 at 10:37 am
regarding the drop in continuing claims- any analysis how much of that may be due to expiration of benefits and people dropping out of the picture???
or- are we on the cusp of economic miracle [snark]
June 18th, 2009 at 10:38 am
As any person with common sense, I’d be sad to see US disappear as a global geo-political power. Which is the primary issue here.
Just plain curious, but why wasn’t the Civil War a major expense to be counted among the Big Historical Events? Off the top of my European head, I would have guessed that as the most financially devastating event in American history.
June 18th, 2009 at 10:40 am
Some of the funds cited in those boxes are “loans” to financial institutions that will be paid back.That stated, there will be a decent % that will never be paid back
——————
And that is exactly why the Fed can get way with it. Semantics.
June 18th, 2009 at 10:42 am
Headline
“New Studies Show Economy Tracking 1930s Declines”
intere4sting excerpt-
“we’re actually all now participating in a sort of lab experiment that will prove or disprove one of the major economic conclusions of the past 70 years: That the original Great Depression was not an inevitable outgrowth of the wild speculation of the 1920s but was caused by “policy errors” after the collapse.”
I guess we will find out who was right
http://finance.yahoo.com/tech-ticker/article/266057/New-Studies-Show-Economy-Tracking-1930s-Declines?tickers=%5Edji,%5Egspc,%5EIXIC?sec=topStories&pos=5&asset=&ccode=
June 18th, 2009 at 10:43 am
Our liabilities exceed our assets, and are growing at an increasing velocity. Future revenues, if any, will be in highly discounted dollars. Reality isn’t a problem once you truly believe it’s all smoke and mirrors.
June 18th, 2009 at 10:44 am
Andy T:
borrowed money is not capital.
June 18th, 2009 at 10:47 am
@ahab: No worries. Those folks who are no longer receiveing unemployment benefits can just work for free as an “intern” somewhere. Problem solved.
June 18th, 2009 at 10:50 am
Mannwich:
better yet, if we ignore them, they’ll go away.
June 18th, 2009 at 10:50 am
EricTyson,
I’ll even make it easy on you. Please compare and contrast the little box on the right entitled ‘New Deal’ with the very large collection of boxes on the left with various individual titles. The New Deal was established in response to an economic collapse, but at least we got a few roads and some dams out of it. The boxes on the left are associated with the type of problem the New Deal intended to solve. The boxes on the left will involve some repayments, but will substantially be written off with only a few McMansions and empty storefronts to show for it, some aggrieved bankers with a sense of entitlement, plus some interesting activity in the commodities markets.
June 18th, 2009 at 11:05 am
Hobo: I already did just that in my first post back to you…are all of you unemployed or retired?! I’ve got to get back to work here!
June 18th, 2009 at 11:22 am
I don’t care how cheerfully anyone analyzes the post. The simple fact is that beginning in Sept of 2008 and continuing until today, the US government has/is effectively nationalize/d at least a third of the economy in a continuing progrom to root out and destroy every vestige of capitalism that once existed. Rahm Emanuel got his “crisis” . He’s making sure Obama doesn’t let it go to waste. Capitalism is dead. Next up for nationalization is health care. That’s another twelve percent or so.
All this comes with a massive price tag, which I see as the point of the chart.
The main vehicle for this expansion of the power, reach and influence of the federal government in the everyday lives of its citizens is the US Treasury and Federal Reserve. Lobbyists are knocking on the Fed’s doors now, never mind Congress, as a recent article by Caroline Baum of Bloomberg noted.
When the Berlin Wall fell in late 1989, followed shortly thereon by the fall of the Soviet Union, the raison d’etre of the federal government’s massive expansion begun in the Great Depression and continued through World War II and the Cold War, ended. There were no longer any existential threats to our continued existence.
So, it would seem reasonable that the Federal government should shrink, no? But no organization ever willingly decreases its purpose, power and size. It is in the DNA of organizations, just like the indivuduals of which it is comprised, to wish to grow ever larger and more powerful, and it will create purposes for itself to that end. Nature makes nurture.
So the FG found a little war to keep itself occupied for awhile (Iraq I). That lasted only a short while, then calm settled over the land and everybody turned their attention to spending the peace dividend by getting rich in the stock market, and watching Congress battle the POTUS over his sexual peccadillos. The FG’s purpose became managing the nuances of the economy through its self-proclaimed and promoted wizard, Alan Greenspan. But just as the stock market illusion was revealed, the FG was saved by a radical terrorist attack on New York. Then its purpose became to fight terrorism across the world, but without sacrifice, going on a bender in expansion of its size, power and influence in order to do so. It borrowed from the future so there would be no sacrifice in the present. Luckily, the wizard Greenspan was there to make it all possible with huge dollops of free money.
When it all collapsed, as any idiot should have well seen would happen, the FG turned its purpose to fixing the mess it had made, ironically, again expanding its power, scope and purpose, this time on a scale never seen.
Peaceful or otherwise, it will take a revolution for this newly-grasped power of the FG to be returned to the people. No organization ever willingly gives up size, power or influence. This graphic just points to the enormity of the task dialing back the FG will be.
June 18th, 2009 at 11:23 am
[...] rich friends or debasing the currency? They are essentially the same thing. Here’s the source of this graphic. Published [...]
June 18th, 2009 at 11:25 am
Senator Shelby Calls Fed’s Expertise “Grossly Inflated” as Geithner Attempts to Defends the Indefensible
http://globaleconomicanalysis.blogspot.com/2009/06/senator-shelby-calls-feds-expertise.html
Like every bloated bureaucracy, the Fed wants still more power. Secretary of Treasury Tim Geithner, a former Fed Governor, is all too happy to give it to them.
June 18th, 2009 at 11:41 am
Morning all – neat graphic. I’m going to have to agree with all those folks on the omissions of the graphics. As many have posted – Where is WWI? Where is WWII? Where is the War of 1812? Spanish American War? Indian Wars?
Has Barry answered as to why none of this is in his graphic? Does anyone know what this graph would look like if all of the above were included? I know the cost of WWII adjusted for inflation was close to 4 trillion dollars. Why is there not a box in the graphic for WWII?
June 18th, 2009 at 11:44 am
[...] as Ritholtz’s graphic illustrates, the bailout has been expensive but comparing it to the combined cost of WWII, the Moon Shot, the [...]
June 18th, 2009 at 12:09 pm
The last past giving the inflation adjusted numbers was great – TOTAL: $3.92 trillion. Add in WWII and you have about 8 trillion. Anyone know the costs for WWI, or the Civil War?
June 18th, 2009 at 12:13 pm
Ahab – I was wondering the same thing about the continuing claims number when it came out this morning. How much of that is due to people who’s benefits who are running out?
June 18th, 2009 at 12:20 pm
[...] Bailout Costs vs Big Historical Events | The Big Pictureritholtz.com [...]
June 18th, 2009 at 12:25 pm
Thor
re: cont. claims
That is the obvious question at this point, isn’t it? And it’s also why this statistic becomes less meaningful as this recession stretches on. The unemployment numbers (U-3, U-6) are more enlightening, even with all their faults.
June 18th, 2009 at 12:27 pm
Thor, the landscape feature in text is not an improvement for me.. especially for instant texting.. the screen isn’t big enough in landscape mode with the keyboard displayed to read the text. Further, the phone is now prone to landscape whether you want it or not.. gotta have a steady hand. Meanwhile, as of the close yesterday when i was updating the iphone, my macbook pro went into backout screen mode… it does that periodically. I have to remove the battery, let it sit, keep turning it off and on… finally got it back up about 30 minutes ago. Meanwhile, I was using a 13″ macbook, that is too, too, small for my windows.. i’ve been unnerved all morning : )
June 18th, 2009 at 12:47 pm
[...] Barry Ritholz: “It is exceedingly difficult to convey exactly how much we are spending o bailouts. Start talking trillions (versus mere billions) and you get puzzled looks from people. Humans have a hard time conceptualizing any number that large. I wanted a graphic way to clearly show how astonishingly ginormous the amounts involved were. This Bailout Nation graphic shows the the total costs to the taxpayer of all the monies spent, lent, consumed, borrowed, printed, guaranteed, assumed or otherwise committed. It is nothing short of astonishing. In one short year the bailouts managed to spend far in excess of nearly every major one-time expenditure of the USA, including WW2, the moon shot, the New Deal, Iraq, Viet Nam and Korean wars — COMBINED. 206 years versus 12 months.” Bailout Costs vs Big Historical Events [...]
June 18th, 2009 at 1:08 pm
@ Marcus Aurelius: The taxpayer will be repaid when individuals stop hiding their money in treasury bonds and again purchase commercial paper and other corporate debt. We are already seeing this to some extent as increased demand (falling yields) for coporate paper and falling demand for treasuries (rising yields). Not all of the money will be repaid obviously. AIG and C and GM may only end up paying back 15 cents on the dollar; but the trillions in commercial paper will likely be 100% paid back.
June 18th, 2009 at 1:15 pm
1. It needs to have WWI and WWII added;
2. You could add what Polk paid Mexico for California – adjusted for inflation, that’s going to be a big number.
3. Mostly, the last 12 months needs color coded, blue and red, for Bush and Obama
June 18th, 2009 at 1:28 pm
My good friend Tom pointed out that it is the government’s role to “invest” in activities like the race to the moon and the Marshall Plan for the good of the nation. I agree with him in principle. I take issue with the size of the “investment”.
Even if all the money invested in the financial debacle were returned, the actions by the Bush and Obama administration substantially increases the size of the government. I don’t believe the Framers intended to put this much control and power in the hands of our 537 elected officials. I’ll have to dust off the Federalist Papers, but I think the Framers wanted the government to define and enforce a framework of commerce. The government’s role was not to be a minimal participant in that framework.
We need to start working now to identify appropriate candidates for the 2012 elections. We need candidates who will allow the commercial framework to function; to allow the bankruptcy courts to orderly wind down failed business experiments; to allow smaller but valid business to thrive on the ashes of the failed behemoths.
Any ideas for candidates?
June 18th, 2009 at 1:30 pm
Karen – Sorry to hear about your iPhone issues
I’ve noticed with my iPod that it tends to change from portrait to landscape at the slightest move in either direction.
What’s the deal with your MacBook Pro going into blackout mode? Does it do that all the time? Have you tried turning off all the power saving features “sleep, screen saver, etc”. Does it do that when it’s plugged into the wall or only when it’s on battery mode? How old is it? Have you called Apple about it? I haven’t experienced that issue with the Macs we have here at work but it sounds like it might be a hardware issue. Hopefully you bought AppleCare with it
June 18th, 2009 at 2:30 pm
BR (to EricTyson)
For example, the 5.5 trillion in Fannie/Freddie mortgages are likely to return at least 95% of exposure.
comment:
——————
Eric, in real number, that itty bitty 5% comes out to 5% of $5,500,000,000,000.
This comes out to $275,000,000,000. That’s a lot of free pizza.
June 18th, 2009 at 2:41 pm
Free marked capitalism is a failed experiment, so what is new
.
———–
We never had free market capitalism. I don’t understand why so many are so blind to this fact.
——–
You cannot cover up failure with semantics. Had it been more free or more capitalistic it would just have been that bigger a failure.
June 18th, 2009 at 3:22 pm
http://market-ticker.denninger.net/archives/1119-The-Saga-Of-The-Bearer-Bonds.html
June 18th, 2009 at 3:40 pm
If your interested who is to blame for this, you might want to view this video
http://video.google.com/videoplay?docid=-2550156453790090544
June 18th, 2009 at 3:42 pm
I second the request to use % GDP instead of real dollars.
June 18th, 2009 at 4:26 pm
Several posters have said this chart would be more meaningful if the programs listed were expressed as a percent of GDP. This assumes that GDP has been at least somewhat of a constant to measure against. The reality is that the formula for calculating GDP has changed over the years, and the influence of certain components of GDP have shifted as well. The nonsense of adding in productivity gains is just one small example. (If people buy computers with 5 times as much memory or processing speed as last year’s model, this swells GDP via a productivity gains formula…even if the people buying the computers lose their jobs and stop using the computers.)
The most glaring problem with treating GDP as a constant of sorts is this: GDP is now composed of 70% consumer spending, which means it is largely a measure of how much we borrow and consume. In the decade or so after WWII, conversely, GDP was more significantly a measure of how much we manufactured and exported. Treating 1950-era US GDP and 2000-era US GDP as something stable and similar to measure against makes no sense.
If the cost of the Marshall Plan was 10% of a creditor nation’s manufacturing-based GDP and a bank bailout is 10% of a debtor nation’s consumer borrowing/spending GDP….are both items equally costly? Are both countries taking an equal risk? Certainly not.
The creditor nation is paying for its plan out of its savings and a proven ability to generate income, and the debtor nation is digging a bigger hole for itself while displaying little or no ability to generate the positive cash flow and productive capacity to repay the debt. Remember also that the debtor nation has to pay greater financing costs in addition to the up-front cost of the plan. The ratio to GDP is the same in both cases, but the risks and additional costs are far greater in the debtor nation scenario.
June 18th, 2009 at 5:38 pm
I think you’ve typo’d the Louisiana Purchase price there. It looks like you’re not normalizing for GDP or other factors (mentioned by others) which is fine, but the LP square looks to be 4x as large as your reference square, putting it at around $200 billion.
The LP purchase price was 15 million 1803 dollars, which in today’s terms is 289.7 MILLION 2009 dollars, not billion. Whoops.
http://www33.wolframalpha.com/input/?i=%2415+million+1803+dollars+today
June 18th, 2009 at 5:46 pm
[...] Immagine della Crisi Riporto un articolo di uno studio americano sulle dimensioni della crisi [la pubblicazione originale la trovate qui]. [...]
June 18th, 2009 at 6:39 pm
Curmudgeon;
There were no alternatives to “we the people” (also called the FG) that could take care of the mess created by way to much freedom and way to little supervision by “we the people”. When capitalism fails the FG has to save the day. You have $ 9 trillion of cash sitting on the side-line scared to death and unwilling to lend to anybody. Perfectly good businesses would go bankrupt and nobody would be able to buy a house, if they suddenly had to pay the 20%+ interest rates that (perhaps) would lure some of that cash to come and do what it is supposed to do. The FG will and should be as big as is needed to prevent a total collapse of society. When capitalism starts functioning again, the private sector can take over all that lending and stuff and we can reduce the FG.
June 18th, 2009 at 8:38 pm
ReggieW:
Henry Ford did not become rich exporting cars to Europe. Arguments that “We were virtuous then but are corrupt now” don’t work if you really do follow the money. For more than 100 years the U.S. has primarily sold to itself. That time frame includes the Roaring 20’s, the Great Depression, WWII, the Post War Boom, The Cold, Korean and Vietnam Wars, and continues to the present day. Most of our buyers are inside THIS country. Even in the previous century the Panics of 1873 and 1857 have been proposed as exemplars of the Panic of 2008.
I’ll agree the the technologies of production have changed, I’ll agree the accounting legerdemain needs to be accounted for. But Shadow-Stats likely already has that covered. GDP would be useful in this discussion to give a real sense of scale to the present madness and past efforts. Flawed is better than absent.
June 18th, 2009 at 9:07 pm
[...] Bailout Costs vs Big Historical Events Published June 18, 2009 9/12 Project , Cultural Issues , Current Events , Domestic Policy Concerns , Economic Issues , U.S. Politics Leave a Comment By Barry Ritholtz – June 18th, 2009, 7:00AM [...]
June 18th, 2009 at 9:18 pm
To jnutley…
Thank you for your insightful points. I knew I was not characterizing the past economy quite right by saying “manufacture and export.” In hindsight, I should have stated it more like this: “GDP has flip-flopped from a measure largely of production (fueled by domestic savings) to a measure largely of consumption (fueled by borrowing from foreign creditors)”, or from a measure of the degree of economic strength to a measure of the degree of economic weakness. I don’t see how measuring the cost of something against the size of the hole we’re in is equivalent to measuring the cost of something against the size of the mountain we used to stand on.
But you’re right…we still need some indication of scale. GDP ain’t what it used to be, so maybe balance of trade or other measures might provide better comparisons. I can’t say I have a better idea at the moment.
June 18th, 2009 at 11:15 pm
So after reading this post, in which the total bailout cost (so far) is given as $15 trillion, I read elsewhere that the Senate is scaling back their proposals for health insurance reform, because extending health care benefits to all US citizens could cost $1.6 trillion over ten years, and that’s too expensive.
Let’s see, $1.6 trillion over ten years, or $160 billion per year… divide that into $15 trillion… that’s a fraction over ONE PERCENT of the cost of the bailouts. It’s not too expensive to spend $15 trillion bailing out the banksters, but we can’t afford to spend one percent of that to provide health insurance to our uninsured citizens.
Maybe instead of talking about costs in terms of dollars, we could invent a new unit of measurement, the mega-bailout. Universal health insurance would cost 0.01 mega-bailouts per year. The Iraq war would cost, say, 0.06 mega-bailouts. Keeps everything in perspective that way…
June 18th, 2009 at 11:50 pm
[...] piece by Barry Ritholtz comparing the bailout versus historic expenses after inflation [...]
June 19th, 2009 at 7:27 am
[...] here: Bailout Costs vs Big Historical Events | The Big Picture No TweetBacks yet. (Be the first to Tweet this post)SHARETHIS.addEntry({ title: “Bailout Costs vs [...]
June 19th, 2009 at 8:19 am
[...] Grafico gastos historicos USA vs rescate de bancos Pues eso un grafico que ayuda a visualizar los mayores gastos del gobierno USA en los ultimos 200 a
June 19th, 2009 at 10:31 am
[...] (A sinistra: i danari impegnati dagli Usa per affrontare l’attuale crisi economica. A destra: le principali spese Usa degli ultimi 206 anni. Fonte: Barry Ritholtz) [...]
June 19th, 2009 at 11:32 am
[...] who are comfortable placing more trust and authority in our central bank. Apparently its placing $15 trillion of public funds at risk in one year (yes, that’s around our total GDP) isn’t reason enough to seek more fundamental reform. [...]
June 19th, 2009 at 12:00 pm
[...] Bailout costs vs big historical events [via The Big Picture] [...]
June 19th, 2009 at 1:07 pm
Where is World War II? World War I? Without those costs, this graph is misleading.
June 19th, 2009 at 3:01 pm
[...] Yesterday, we looked at the costs of various one time events versus the bailouts. It took one year of bailouts to rack up the debt totals of 206 years of war, westward expansion, [...]
June 19th, 2009 at 8:42 pm
[...] Graphic: Size of the Bailout Compared to Major Past Expenditures – A real eye opener. Barry Ritholtz Comments (0) Trackbacks (0) Leave a comment Trackback [...]
June 19th, 2009 at 9:59 pm
[...] Graphic: Size of the Bailout Compared to Major Past Expenditures – A real eye opener. Barry Ritholtz [...]
June 20th, 2009 at 2:30 pm
[...] This blog post… well, just read: In just about one short year (March 2008 – March 2009), the bailouts managed to spend far in excess of nearly every major one time expenditure of the USA, including WW1&2 (omitted from graphic), the moon shot, the New Deal, total NASA budgets (omitted from graphic), Iraq, Viet Nam and Korean wars — COMBINED. [...]
June 21st, 2009 at 2:14 pm
[...] the vast majority incapable of conceptualizing such numbers, the following Bailout Nation graphic shows the the total costs to the taxpayer of all the monies spent, lent, consumed, [...]
June 22nd, 2009 at 12:21 pm
[...] Cost of the Bailout Posted by Jonny under Economy Leave a Comment Barry Ritholtz’s blog gives a graphic showing the comparative cost of the bailout, thus showing it is indeed massive and [...]
June 22nd, 2009 at 1:54 pm
[...] This is the definition of “cost center.” Puts our costs perspective. (Source: The Big Picture) [...]
June 23rd, 2009 at 12:57 am
[...] The Big Picture Diesen Artikel speichern oder [...]
June 26th, 2009 at 9:48 am
[...] The Big Picture: Bailout Costs vs Big Historical Events – “It is exceedingly difficult to convey exactly how much we are spending on all these bailouts. Whenever I start talking trillions (versus mere billions), I get puzzled looks from people. Humans have a hard time conceptualizing any number that large. I wanted a graphic way to clearly show how astonishingly ginormous the amounts involved were.“ [...]
July 21st, 2009 at 5:13 pm
Here’s a visualization in video form:
http://www.mint.com/blog/trends/one-trillion-dollars-video/