Most of the Media and Wall Street economists have had the inherent tendency to get this data wrong . . . the latest batch of releases is no different . . .
Consider these charts before you conclude that Residential RE is improving:
>
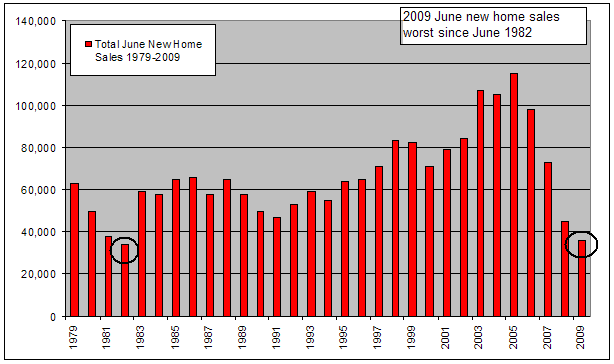
June 2009 NSA New Home Sales Worst Since 1982
As Floyd Norris noted, “This was the second-worst June since they began counting new-home sales in 1963. It was not quite as bad as June 1982, when the country was mired in a deep recession and interest rates were sky high. Then 34,000 new homes were sold. There are twice as many households in America today as there were then, so relative to population this was the worst June ever, by far.
>
IT’S TAKING A YEAR FOR HOMEBUILDERS TO FIND BUYERS

Source: Haver Analytics, Gluskin Sheff
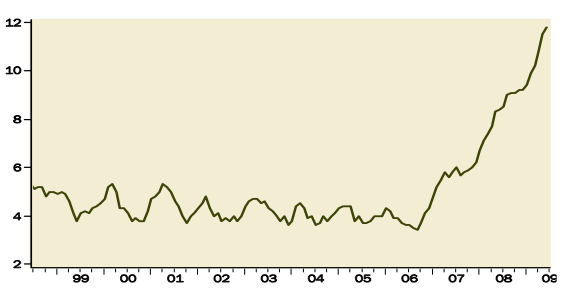
David Rosenberg notes in the chart above (United States: New Single Family Homes) that Median Number of Months for Sale (months)is still rising. Sign of a bottom? Hardly.
>
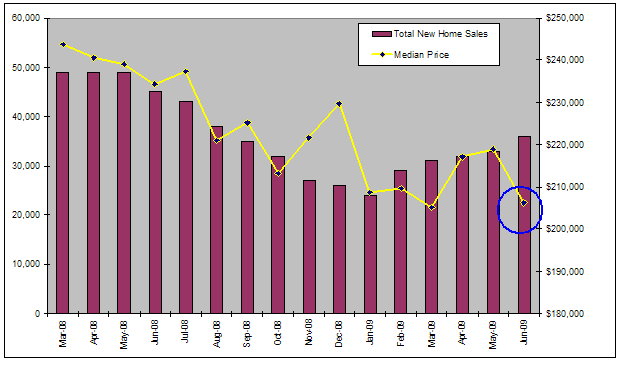
Builders Are Slashing Prices to Dump Inventory
Bbuilders are slashing prices to dump inventory ahead of the slow season after the summer.
>
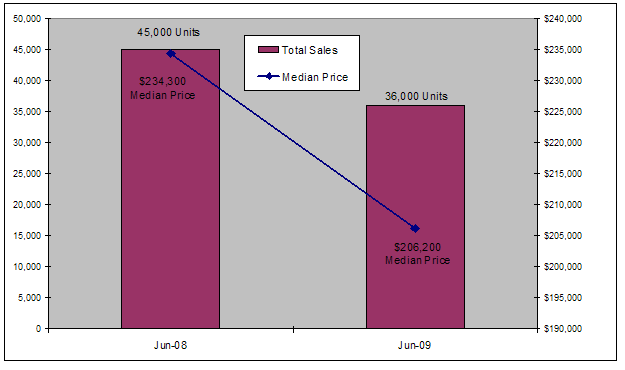
New Homes, NSA, Unit Sales and Prices
The chart above shows NOT seasonally adjusted June 2008 vs June 2009 total sales counts and median price. 20% fewer homes sold — at much lower price than last year — is somehow bullish?
~~~
CONCLUSION: The best thing you can say is the 2nd derivative argument — Real Estate is now getting worse more slowly. Expect more price decreases, foreclosures and distressed sales. A healthy market cleared out of excess inventory with genuine price increases is likely years away . . .


What's been said:
Discussions found on the web: