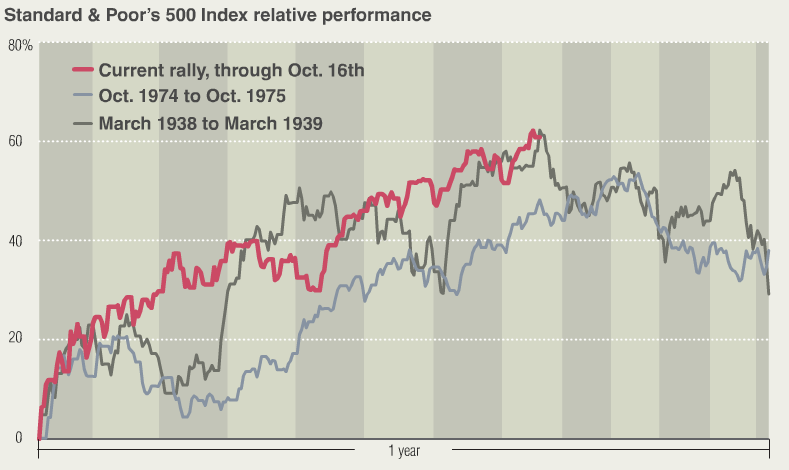
Predictions that U.S. stocks would decline in September and October weren’t wrong, just early, says Mary Ann Bartels, an analyst at Bank of America Corp. The CHART OF THE DAY shows how the Standard & Poor’s 500 Index’s surge from its 12-year low on March 9 compares with rebounds from troughs in March 1938 and October 1974. Using the earlier rallies as a guide suggests the “seasonal weakness” that stocks often suffer in September and October will occur in November, December and January instead, she wrote.
>
courtesy of Bloomberg
>
The 1930s advance appears in the chart’s top panel and the 1970s surge is in the bottom panel. In both cases, the S&P 500 fell more than 10 percent from its peak after the rally ended, surpassing a commonly used threshold for a stock correction.
>
Source:
Seasonal Drop in U.S. Stocks May Just Be Delayed: Chart of Day
David Wilson
Bloomberg, Oct. 19 2009
http://www.bloomberg.com/apps/news?pid=20601109&sid=aEWacWSz6VOs


What's been said:
Discussions found on the web: