The Place Where Reform Goes to Die

Email this post Print this post
By Barry Ritholtz - December 29th, 2009, 5:21PM

One of the best things I have ever read on Huff Po –  The Cash Committee: How Wall Street Wins On The Hill — explains how Wall Street manages to win in Congress, no matter who is the controlling party.

The Banking committee has become the place where reform goes to die.

“In the fall of 2008, Democrats took the White House and expanded their Congressional majorities as America struggled through a financial collapse wrought by years of deregulation. The public was furious. It seemed as if the banks and institutions that dragged the economy to the brink of disaster — and were subsequently rescued by taxpayer funds — would finally be forced to change their ways.

But it’s not happening. Financial regulation’s long slog through Congress has left it riddled with loopholes, carved out at the request of the same industries that caused the mess in the first place. An outraged American public is proving no match for the mix of corporate money and influence that has been marshaled on behalf of the financial sector.”

Yes another tactical error by the Dems:

In short, by setting up the committee as a place for shaky Democrats from red districts to pad their campaign coffers, leadership made a choice to prioritize fundraising over the passage of strong legislation. “It makes it difficult to corral consensus,” says Rep. Stephen Lynch (D-Mass.), a subcommittee chairman, of the unwieldy panel.

And just as the lure of money leads inexperienced new members to join the committee, it prompts experienced staffers to bolt for larger paydays in the private sector. “You have this phenomenon where if you have a staffer who’s very experienced on a certain issue and is dealing with the financial sector for any number of months or years, all of a sudden they become a real acquisition target for Wall Street,” says Lynch.

The key takeaway: Both parties are beholden to corporate interests.

>

Previously:
Tactical Error: Health Care vs Finance Regulatory Reform (September 9th, 2009)

http://www.ritholtz.com/blog/2009/09/finance-reform-vs-health-care-reform/

Source:
The Cash Committee: How Wall Street Wins On The Hill
Laura Bassett, Jeff Muskus and Elyse Siegel
Huff Po, December 29 , 2009

http://www.huffingtonpost.com/2009/12/29/the-cash-committee-how-wa_n_402373.html

Fannie, Freddie, Heading to Zero

Email this post Print this post
By Barry Ritholtz - December 29th, 2009, 1:37PM

What did it mean to investors when Freddie & Fannie shares jumped (27% and 21%) and their trading volume for both was the highest since late October?

Not much. The most recent political news is that the White House has granted the former GSEs a blank check — no cap on aid. (Hence, why they are now former GSEs). That was the cause of their share price rally. But what does this mean for the companie’s future?

Nothing good. It signals that Uncle Sam will likely use the firms — the government owns 80% of both — to intervene further in the housing market.

Here’s Tom Petruno with the details:

“But whatever additional federal money flows into Fannie and Freddie would almost certainly come at the expense of shareholders’ remaining stake. The government now owns 80% of both firms.

The administration is supposed to announce its long-term strategy for Fannie and Freddie in February. The companies’ losses could continue to balloon if, as some analysts suspect, the White House were to seek to use the companies to support new mortgage-forgiveness programs that would help struggling homeowners.”

One other factor Petruno notes: “The pay packages the Treasury announced Thursday for the companies’ chief executives consisted exclusively of cash compensation; no shares were offered.”

Likely outcomes? The two firms actual value falls to zero . . .

>

Source:
Fannie and Freddie shares soar, but for no good reason
Tom Petruno
LA Times, December 28, 2009 | 3:37 pm

http://latimesblogs.latimes.com/money_co/2009/12/fannie-mae-freddie-mac-stocks-obama-treasury.html

All the News

Email this post Print this post
By Barry Ritholtz - December 29th, 2009, 11:30AM

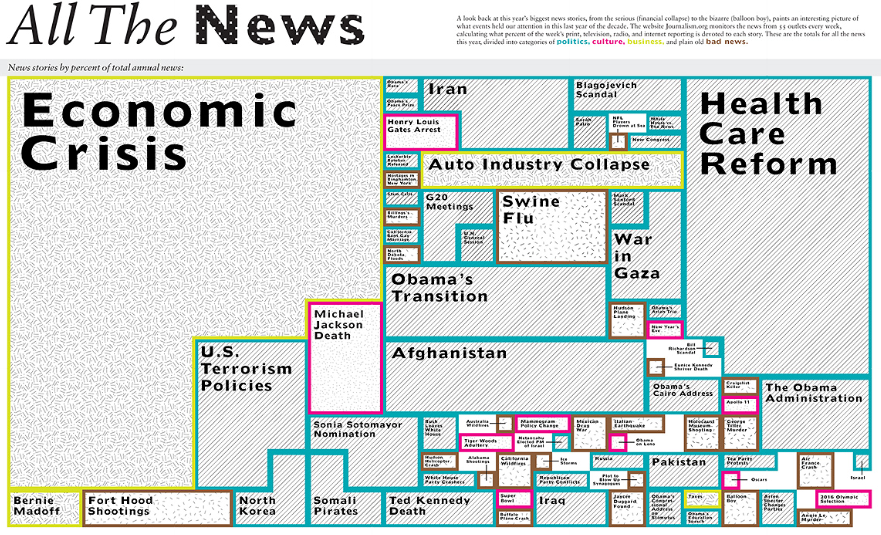
In lieu of our usual lunch time chart, let’s have a go at this cool infographic, via Good, showing the biggest news stories of the year:

click for interactive graphic:

Hat tip Neatorama

Welsh Investment Letter – December 2009

Email this post Print this post
By Jim Welsh - December 29th, 2009, 10:30AM

~~~

HAPPY HOLIDAYS and HAPPY AND HEALTHY NEW YEAR!

ECONOMY

As first forecast last March, the U.S. economy was going to experience a V-shaped recovery that at first would be more statistically based. As discussed in the May letter:

A dissection of the -6.1% decline in first quarter GDP will underscore why a turnaround in GDP is coming. The decline in residential construction subtracted -1.36% from GDP. However, single family housing starts have held steady for the last 4 months through April. With housing starts already down 80% from their peak three years ago, there is a good chance starts will continue to stabilize near 350,000, a very depressed level. By the time the fourth quarter arrives, the drag to GDP from residential construction could be near zero, and possibly a slight positive. Businesses slashed inventories a record $103.7 billion in the first quarter, which shaved -2.79% from GDP. Last week, 52 million Social Security recipients began receiving their $250 economic recovery checks. Along with other measures within the $787 billion fiscal stimulus plan, consumers will have more disposable income, which will lift demand in coming months. This will help align sales with production and inventories, so the large drag from inventories will be far less in the second half of 2009.

Business investment on new buildings and equipment plunged 38%, the most since 1947. This accounted for the bulk of the -4.68% non-residential investment subtracted from first quarter GDP. Although commercial real estate will remain weak in coming quarters, business investment has begun to stabilize. Even if business investment doesn’t pick up by the fourth quarter, the negative drag on GDP will be less.

The lone bright spot in the first quarter was a 2.2% increase in consumer spending, which added +1.5% to GDP. Although consumer spending will continue to be pressured by job losses and weak income growth, various aspects of the stimulus plan should help maintain consumer spending near first quarter levels.

This breakdown of first quarter GDP shows that most of the improvement by the fourth quarter will result because the extreme weakness in the first quarter will have flat lined, causing most of the GDP components to go from deeply negative toward zero. That may be better than the alternative, but it is no substitute for a healthy pick up in demand. It’s a bit like sitting down for a delicious five-course gourmet dinner, and only being served a plate of Cheetos.”

By the third quarter, most of the shifts had occurred, and various aspects of the fiscal stimulus were clearly evident in the 2.2% gain in GDP. Motor vehicle output added 1.45%, spurred by the Cash for Clunkers program. New homes sales were a net positive, aided by the $8,000 first time home buyers tax credit. A swing in inventories actually added .69%, and personal consumption contributed about 2%. Most of these factors, along with a gain in exports should help fourth quarter GDP to push 4%. But as I noted in the May letter, “The most important issue in the next 12 to 15 months is whether the rebound in the second half of 2009 and first half of 2010 will gain enough traction to launch a self sustaining economic recovery. The short answer is no one knows.”

As we enter 2010, the largely statistical recovery to date should strengthen, and include more gains from inventory accumulation, fiscal stimulus, and an irregular improvement in job growth. The loss of only 11,000 jobs in November likely overstated the near term health of the labor market, but there were other positives signs. As noted last month, temporary employment changes are a good leading indicator. In November, temporary jobs increased 52,400, the fourth consecutive month of gains. The workweek rose to 33.2 hours from a record low of 33.0 hours, and overtime hours also increased. As noted previously, job growth of 125,000 is needed to reduce the ranks of unemployed workers, and could appear by the end of the first quarter. If this is to occur, the historical record suggests that the four week moving average of weekly jobless claims will have to fall and remain below 400,000. Hiring for the 2010 census will peak in April and May, when up to 800,000 workers are needed. The average census job will require 20 hours of work each week, pay between $10 and $25 an hour, but only last for six weeks. I suspect the Census Bureau will be swamped with applications. In addition, every economic statistic will look much better when compared to the extraordinary weakness in the first quarter of 2008.

As discussed in the September letter, there are a number of secular headwinds that will weigh on the economy for 3 to 5 years. Total debt as a percent of GDP has risen from $1.65 in 1982 to $3.70 in 2009. Household debt is now 97% of GDP, up from just 44% in 1982. The burden of total debt and household debt cannot be lessened with lower interest rates, since interest rates are already at generational lows. As this debt was being assumed over the last 25 years, annual GDP was higher than it otherwise would have been. Since consumers will not being able to increase their debt at the same pace, annual GDP growth will be slower, until the ratio of household debt is a good deal lower than it is today. My guess is that it will fall back to 90% or less, before consumer balance sheets will be healthy enough to support a new secular economic expansion. The savings rate was almost 10% in 1982. Although it has climbed to 3% to 4%, it is likely to rise further as consumers cut back on their spending. This task will be made more difficult, if the economy grows more slowly in coming years, since personal income will also grow more modestly. Another drag on growth will come in the form of higher federal taxes to lower the massive deficits that are being created by Congress. In addition, the overall level of regulation is going to increase, which will add to the cost of doing business in the U.S.

There are also a number of cyclical headwinds that will weigh on growth in the next 2 years. Banks of all sizes have billion more in losses to work through. Commercial real estate has not bottomed, and this will affect many mid sized banks that were overly aggressive in their lending to regional commercial developers. Residential home prices are likely to decline further, as the foreclosure pipeline is still building. Although the labor market should continue to improve, the level of unemployed and underemployed workers will remain high for most of 2010, which will restrain consumer spending. This will force banks to keep lending standards high, and the volume of new lending lower than it needs to be to support a sustainable recovery. State spending has averaged 6% annually over the last 30 years. Revenues are down 11% as of September 30, which is forcing states to raise taxes and cut their spending. All of these factors should result in a sub par recovery that does not inspire corporations to substantially boost their business investment plans or their hiring. Each of these secular and cyclical headwinds are significant, but the combination of all of them interacting and reinforcing each other will be a formidable hurdle for the economy to make a smooth transition from the stimulus spurred V-shaped recovery, into a self sustaining recovery that can gains traction as 2010 unfolds.

In addition, by the end of the first quarter in 2010, the Federal Reserve will have phased out the majority of the special liquidity facilities that have been especially supportive of the credit market in general, and the mortgage security market specifically. The housing market will be hurt, if mortgage rates rise as I expect. If rates rise too much, the Fed may step in again. As noted in its post FOMC statement for the December 16 meeting, “The Federal Reserve is prepared to modify these plans if necessary to support financial stability and economic growth.”

Read the rest of this entry »

Case Shiller Home Prices: Improvement Moderating

Email this post Print this post
By Barry Ritholtz - December 29th, 2009, 9:12AM

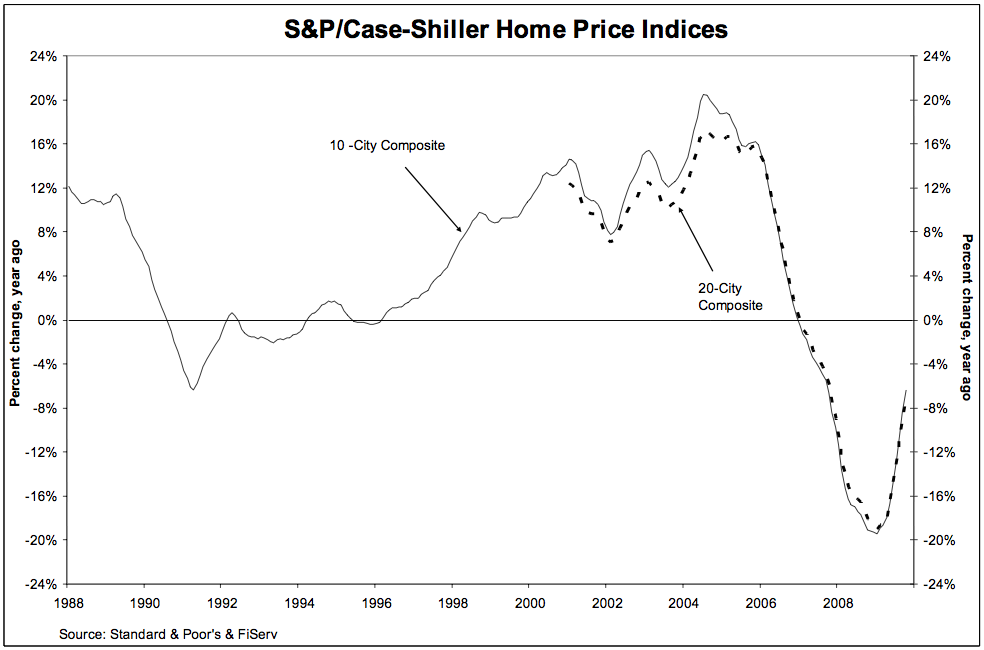
The latest data from Case Shiller, covering the October 2009 period, shows an ongoing improvement in price data.

This was the 9th consecutive month of gains. As the chart below shows, year-over-year data for the 10-City and 20-City Composite Home Price Indices, fell 6.4% and 7.3%.

Peak-to-date figures for the indices through October 2009 are -29.8% and -29.0%; Peak to trough (April 2009) composites are down 33.5% and 32.6%, respectively.

S&P noted “The turn-around in home prices seen in the Spring and Summer has faded, with only seven of the 20 cities seeing month-to-month gains, although all 20 continue to show improvements on a year-over-year basis.

>

Case Shiller Index October 2009

click for bigger graphic

All data courtesy of S&P/Case Shiller

>

More charts after the jump . . .

Read the rest of this entry »

Silent Monks Singing Hallelujah

Email this post Print this post
By Barry Ritholtz - December 29th, 2009, 9:00AM

Highly amusing: Creative high schools students give a great rendition of Hallelujah!

Hat tip Carl

Higher-End Homes Still Declining

Email this post Print this post
By Barry Ritholtz - December 29th, 2009, 8:30AM

“The rich aren’t as rich as they used to be.”

-Alex Rodriguez, a Miami real estate agent with JM Group USA

>

Real Estate agents are masters of the obvious, aren’t they? “This is the kitchen” they proclaim as if a buyer couldn’t deduce that from the refrigerator, stove and dining table.

And so too, is that obvious quote up top. Yes, the rich have less money. But so does nearly everyone else. With the rich, the amounts in question are simply much greater, individually and collectively, in terms of assets lost. As David Rosenberg has pointed out, “In 2009, household net worth contracted nearly 20% over the past year and a half. That’s an epic $12 trillion of lost net worth, a degree of trauma never seen before.”

The improvements in Housing appear to be driven by lower end subsidies. The most recent Housing data makes clear the dominance of low end sales. As noted earlier, last month’s existing home sales saw a 60% increase in cheaper condos and coops.

This reflects several ongoing themes that will continue to impact Housing the next few quarters:

1) Credit availability remains tight: The pendulum has swung from giving anyone who can fog a mirror to denying creedit to well qualified applicants. For entry level homes, a strong mortgage applicant has a good credit score, steady income, and can put 0% down. Higher end homes are tougher to finance. Anecdotally, some deals require 30-40% down on a $1 million plus home;

2) Housing Bailouts aim at the low end: Extensive government subsidies (1st time tax credit, low mortgage rates) falls primarily to low end purchasers; The higher end purchaser has the benefit of lower interest rates but pay a 100 bp premium on Jumbo mortgages; Credit for jumbos (> $417k) are especially tight.

3) Homeowners with mortgages of more than $1 million are defaulting at 2X the median rate. Lower-end homes are now decreasing as part of the total foreclosure pie; Zillow.com reports middle- and high-end homes are becoming a larger proportion of defaults.

This is significant, due to the important role more expensive (aspirational) homes play in the food chain. A big driver of sales is the “trade up” buyer. Now that entry level sales are improving, the chain of transactions needs to keep moving on up. The potential for

While its been a huge improvement to see starter homes selling, its primarily been driven by distressed transactions — 30-50% of alle existing home sales — and government subsidies.

The low end bailouts are ill conceived and counter-productive. Foreclosures serve a valid purpose, one that is driving the real estate market back towards its proper levels. These housing bailouts are populist driven, with a quid pro quo in them for the bank bailouts. Both will prove to be counter productive over the long haul.

Case Shiller Index out today at 9am . . .

>

Source:
Higher-End Homes Face the Price Pressure
MARK GONGLOFF
WSJ, DECEMBER 29, 2009

http://online.wsj.com/article/SB20001424052748704134104574624661382421076.html

Why 2010 Looks So Dicey
David Rosenberg
BusinessWeek, December 17, 2009,

http://www.businessweek.com/magazine/content/09_52/b4161112222655.htm

Luxury-Home Owners in U.S. Use ‘Short Sales’ as Defaults Rise
Kathleen M. Howley and Dan Levy
Bloomberg Dec. 17, 2009

http://www.bloomberg.com/apps/news?pid=20601214&sid=aQED_96QBBkk

2009: Bulls Bet Big on Bernanke, Batter Bears

Email this post Print this post
By Barry Ritholtz - December 29th, 2009, 8:15AM

Source:
2009 Review: Bulls Bet Big on Bernanke, Batter Bears
Aaron Task
Yahoo Tech Ticker, Dec 29, 2009 08:00am EST

http://finance.yahoo.com/tech-ticker/2009-review-bulls-bet-big-on-bernanke-batter-bears-397025.html

Stocks higher again as are bond yields

Email this post Print this post
By Peter Boockvar - December 29th, 2009, 7:56AM

Another global rally in stocks is resulting in another selloff in global bond markets and in some countries, yields are breaking out. UK and Canadian 10 yr bond yields are rising to 13 month highs, and Australia and the US are back to 5 month highs. For now, the relationship is obvious in that the stock and bond markets are responding to the growing optimism for global growth but the question remains open, particularly for the overleveraged countries such as the US, of at what level do rates begin to hurt and create its own speed bump to growth. The Oct S&P/CaseShiller home price index is expected to rise to the highest level since Dec ’08 with an estimated drop of 7.2% y/o/y. The move higher over the summer was due to the home buying tax credit and moratorium in foreclosures from certain banks which are both temporary, thus prices should reverse lower in 2010. Also, mortgage rates today are at a 4 1/2 month high according to Bankrate.com.

Panasonic Lumix DMC-ZS3 and ZS1

Email this post Print this post
By Barry Ritholtz - December 28th, 2009, 7:30PM

The post-holiday mark downs continue:

I spotted my camera — Panasonic Lumix DMC-ZS3 10.1 MP Digital Camera with 12x Wide Angle MEGA Optical Image Stabilized Zoom and 3 inch LCD (Black) — $50 cheaper than I paid 3 months ago. (I replaced the Casio Exilim; that 3X optical zoom wasn’t doing it for me).

The Lumix is on sale at Amazon for $241.45.

Look at that giant honkin’ 12X optical zoom — that was the key for me. Its got a big ass Leica lens, nice 3″ LCD screen, and has all the bells and whistles you could want, plus HD video recording.

Its about as nice a point and shoot as I’ve ever seen.

If you want to go even cheaper, drop the video and get the Panasonic Lumix DMC-ZS1. It has all of the same features, but without the video — $199.

~~~

I have long said that consumer electronics comes down in price not as a function of deflation (See Hackonomics, section 3), but due to the economies of scale as more consumers adapt the technology.  This seems to be a classic example — 3 years ago, this was a $650 piece of hardware.

42 queries. 1.089 seconds.