We won’t get the final numbers til after the close today, but here is what they look like going into the final session:
• Nasdaq is up 45%; Its the big winner for 2009 of the major US Indices;
• S&P 500 index up 25% for the year.
• Dow Jones Industrial Average is up 20% for the year (up 61% from its March lows); Transports are up 18%.
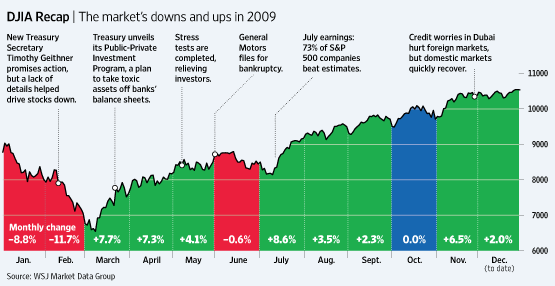
Here is how the year looked, month by month, along with major events:
Chart courtesy of WSJ
~~~
Today also marks the end of the decade as well as the year.
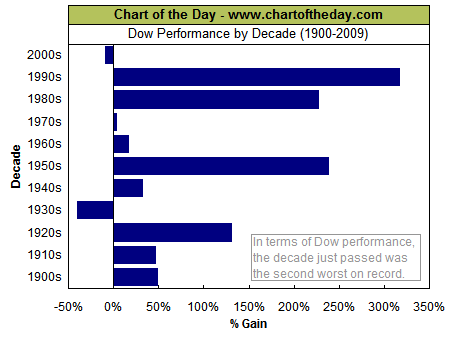
Below you will see a chart depicting the price performance of the Dow for each decade since 1900. As you can see, from the close of 1999 through 2009 was the second worst performance on record. Only the Great Depression decade of the 1930s was worse.
The current zeros decade also shares an unfortunate outcome with the 1930s in being a decade during which the Dow actually ended lower than where it started.
Happy 2010!
Chart courtesy of Chart of the Day


What's been said:
Discussions found on the web: