Infinite Stackable USB Cables

Email this post Print this post
By Barry Ritholtz - March 31st, 2010, 8:03PM

How cool is this, from Gonglue Jiang, a desing student at Zhejiang University:

>

via Design Fetish

Wednesday Linkage

Email this post Print this post
By Barry Ritholtz - March 31st, 2010, 5:35PM

These few stories caught my eye today:

Obama: Drill Baby Drill (NYT)
The Lone Star Secret: How Texas avoided the worst of the real estate meltdown (Slate)
Martin Wolf:  Why Germany cannot be a model for the eurozone  (FT)
• How Lou Lucido Let AIG Lose $35 Billion With Goldman Sachs CDOs (Bloomberg)
Top Executive Salaries in America (Meet the Boss)
Paul Volcker: Do The Right Economic Thing (Baseline Scenario)
• Decriminalizing pot would devastate cartels (Chicago Suntimes)
• Nissan Leaf electric car will cost $25,000 (CNN/Money)
• 8 Wonders of the Solar System, Made Interactive (Scientific American)

What are you reading?

Change in US Employment Recession/Recovery

Email this post Print this post
By Barry Ritholtz - March 31st, 2010, 2:45PM

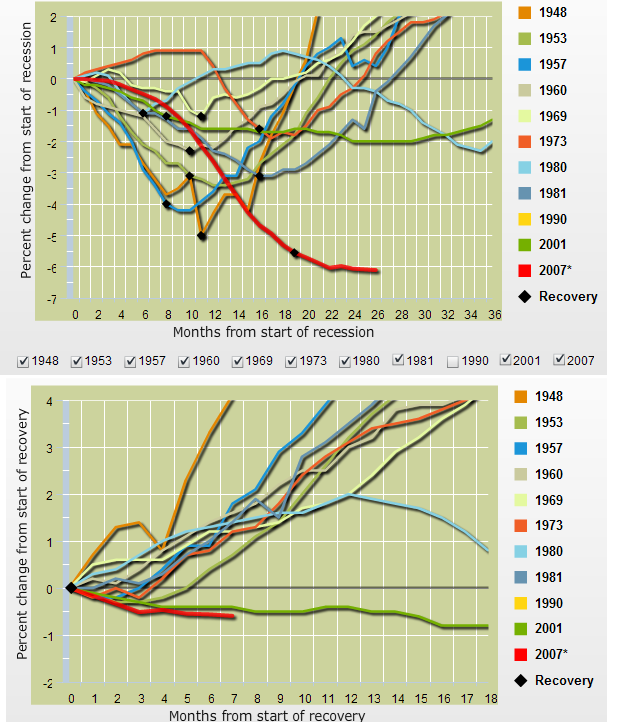
If you found the prior post on Employment too cheerful, well, have a gander at these charts, courtesy of  The Federal Reserve Bank of Minneapolis by way of Jim Picerno’s Capital Spectator.

This is a fascinating look at where in each post war recession the recovery can be marked as beginning.

Have a look at the bottom chart; If the 2007-09 Recession end up being anything like the 2001 recession, we are still 4 or 5 years away from a full jobs recovery back to employment levels prior to the crash.

>

The Recession and Recovery in Perspective

click for interactive version

JOC index reaches highest level since Sept ’08

Email this post Print this post
By Peter Boockvar - March 31st, 2010, 2:34PM

To add more fodder to the inflation/deflation debate, the Journal of Commerce Industrial Commodity Index of 18 industrial materials is rising today to the highest level since Sept 2008. Some of the commodities included in the index are crude oil, aluminum, zinc, cotton, steel, copper, nickel, plywood, hides, rubber and ethylene.

Blitzer: Fading Housing Implies Double Dip ?

Email this post Print this post
By Barry Ritholtz - March 31st, 2010, 11:54AM

>

More here

Payroll Withholding Taxes Surge in March

Email this post Print this post
By Matt Trivisonno - March 31st, 2010, 11:30AM

Matt Trivisonno shares with us some of the research he does at Daily Jobs Update regarding payroll withholding taxes.

He notes that in March, there has been a very strong surge in withholding taxes. The amount is roughly equivalent to 300,000 new workers being paid $30,000 salaries.  Matt presume many of these jobs are Census hires.

How he arrived at the 300,000 estimate:

In February, the un-adjusted growth in withholding taxes over February 2009 was -2.28%. For the first 21 business days of March, the growth rate is +3.12%. That’s a miraculous 5% jump, the bulk of which is almost certainly the result of Census Bureau hiring. Let’s take a look at how many new jobs would fit this size of a leap:

The dollar amount of March’s gain is $4,764,000,000.

Divide that by 21 days, and we get a daily average of $226,860,000.

Divide that by 5 and we get $45,370,000 per work week.

So, how many new workers would be required for the IRS to rake-off $45,370,000 per week more in taxes this month? A good ballpark figure might be 300,000 new jobs.

If you hired 300,000 workers and paid them an average annual salary of $30,000, your weekly payroll would be $173,076,923 (300,000 * 30,000 / 52).

If you withheld 26.5% in taxes from each paycheck, the total would be $45,865,385 ($173,076,923 * 0.265), which is pretty close to the increase in March’s withholdings so far.

However, the withholding data is not detailed in any way by the Treasury Department, and we only have totals to work with. So, we can only make very, very rough estimates since there is a wide range of salaries, multiple tax brackets, and the fact that many workers will have had their hours increased as opposed to being newly hired.

Nevertheless, the Bureau of Labor Statistics should report a very large number on Friday morning.

The Census Bureau hasn’t published any hiring statistics that I have seen, but the consensus among economists is that they have hired 100,000 workers in March. They could have hired quite a lot more of the planned 1.2 million total, but the army of door-knockers isn’t scheduled to hit the streets until May, though they will likely go on the payroll for training well before then.

The bottom line is that Friday’s jobs report should be very strong, though it could disappoint the market if the Census Bureau was responsible for the bulk of hiring as opposed to the private economy.

All data and charts via Matt Trivisonno Trivisonno.com and Daily Jobs Update

Global bonds higher but Greece getting no respect

Email this post Print this post
By Peter Boockvar - March 31st, 2010, 10:35AM

Greece still is getting no respect. While global bond markets are rallying in response to the weaker than expected ADP report and the Chicago PMI (half of the factory order # was out last week when Durable Goods orders were released and thus is rarely market moving), Greek bonds again are not as Greece can do little right in convincing the global community that their debt is money good and their deficit cutting plans will be implemented as said. The Greek 10 yr yield is rising another 8 bps to 6.52%, a 5 week high, their 2 yr yield is up by 22 bps to 5.13%, matching a 4 week high and 5 yr Greek CDS is wider by 7 bps to 340, just shy of a one month high. While the IMF/EU deal with Greece created an important backstop, it did nothing to lower the cost of Greek borrowing as hoped as it seems investors want to see actual results of deficit cutting rather than just promises.

Chicago PMI disappoints

Email this post Print this post
By Peter Boockvar - March 31st, 2010, 10:20AM

The Mar Chicago PMI manufacturing index was 58.8, about 2 pts below estimates and down from 62.6 in Feb which was the highest since April ’05. It is still the 3rd highest reading dating back to mid ’07 but it follows the weaker than expected ADP report and with the market a straight line over the past month, there is little tolerance for below forecasted data. New Orders fell a touch to 61.8 from 62.2 but it is the lowest since Oct ’09. Backlogs fell 4.2 pts but just gives back the Feb spike. The Employment component was about unchanged at 53.1. Prices Paid fell 1 pt to 66.6 but is 7 pts above the 1 yr average. The big change within the data was the 10 pt jump in Inventories which rose above 50 for the first time since Oct ’08. This component will statistically lift GDP if its followed in other regions and hopefully it was built to meet existing demand rather than in the hopes of a pick up in demand that may or may not come. The ISM is out tomorrow.

Did US Housing Have a Boom/Bust Cycle?

Email this post Print this post
By Barry Ritholtz - March 31st, 2010, 10:03AM

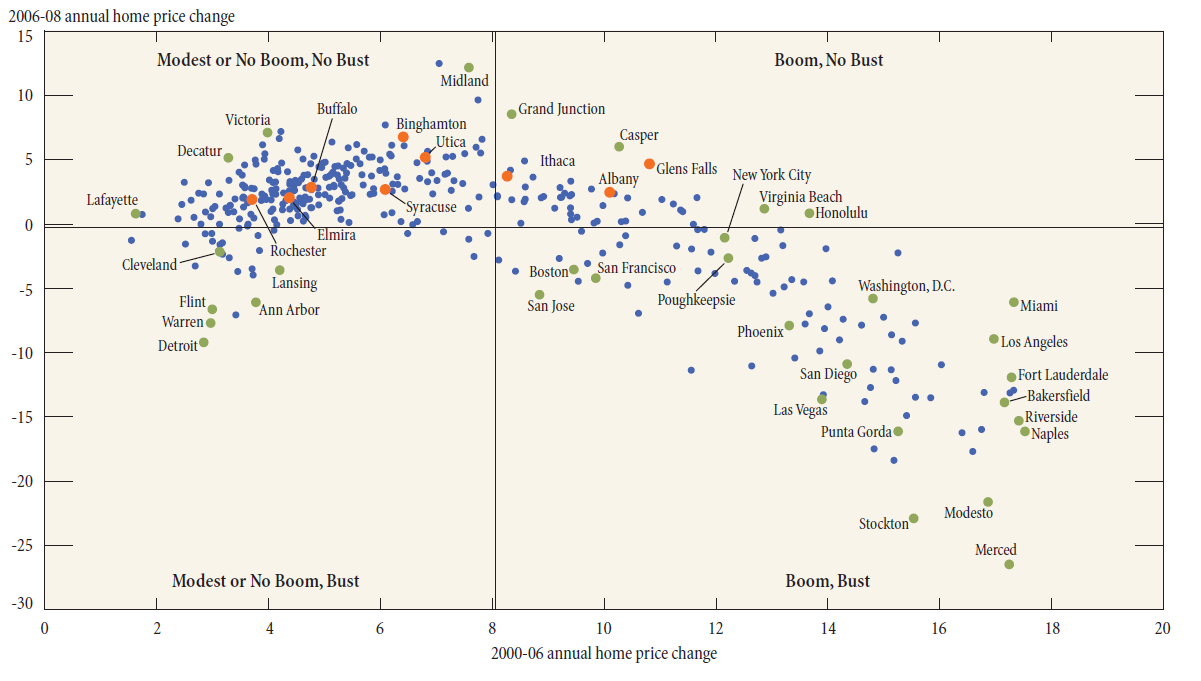
The NY Fed has a curious research piece out, looking at areas of Upstate New York that were “insulated” from housing price volatility.

They note that many parts of the country have not experienced dramatic declines in housing prices, and upstate metropolitan areas of Buffalo, Rochester, and Syracuse even enjoyed price increases during the recession.

The NY Fed suggests the reason why is fairly simple: “The region’s relatively low incidence of nonprime mortgages.”

>

Metro Area Home Price Appreciation, 2000-08

click for larger chart

>

Geographic Distribution of Boom/Bust Metropolitan Areas

Sources: Federal Housing Finance Agency, All Transactions index; Moody’s Economy.com

>

The one caveat I would add is that the coastal populations are far larger, and have a greater density (i.e, on less land),  than the non coastal Western areas and Southeast. See this cartogram for a graph of what this looks like.

Hat tip Real Time Economics

>

Source:
Bypassing the Bust: The Stability of Upstate New York’s Housing Markets during the Recession
Jaison R. Abel and Richard Deitz
FEDERAL RESERVE BANK OF NEW YORK Second District, March 2010
Volume 16, Number 3
http://www.newyorkfed.org/research/current_issues/ci16-3.pdf

Q2 Preview

Email this post Print this post
By Barry Ritholtz - March 31st, 2010, 9:15AM

Be sure to check out the excellent overview of the present situation from Damien Cleusix in the Think Tank: Global Tactical Asset Allocation, Q2 2010

44 queries. 1.128 seconds.