I was at 30,000 feet when the crash hit on Thursday. When I landed in NY and saw what happened, the first thought was trader error. But the evidence for that remains lacking. I spent a good part of the weekend trying to track down evidence that it was HFT, or a fat thumb, or a NYSE erroneous trade halt.To date, the best analysis I’ve seen came from a young analyst on an institutional desk. His forensic approach to piecing together what occurred is the best explanation I have come upon:
~~~
While “trader error” or “a fat finger” may have been a catalyst for certain elements of the decline, it also may not have been. It may have been a “computer error” and it may not have been.
Do you notice how we’re unwittingly restricting our analysis to what the sellers did? The offer side of the trading that saw the S&P 500 lose -5% of its value in the span of about 3 minutes – that after it had already declined by over -3% – is a RED HERRING. It’s misdirection – hand wringing over what is irrelevant at the expense of ignoring what is relevant…and what’s relevant is the bid side of the market, that is, what the buyers did.
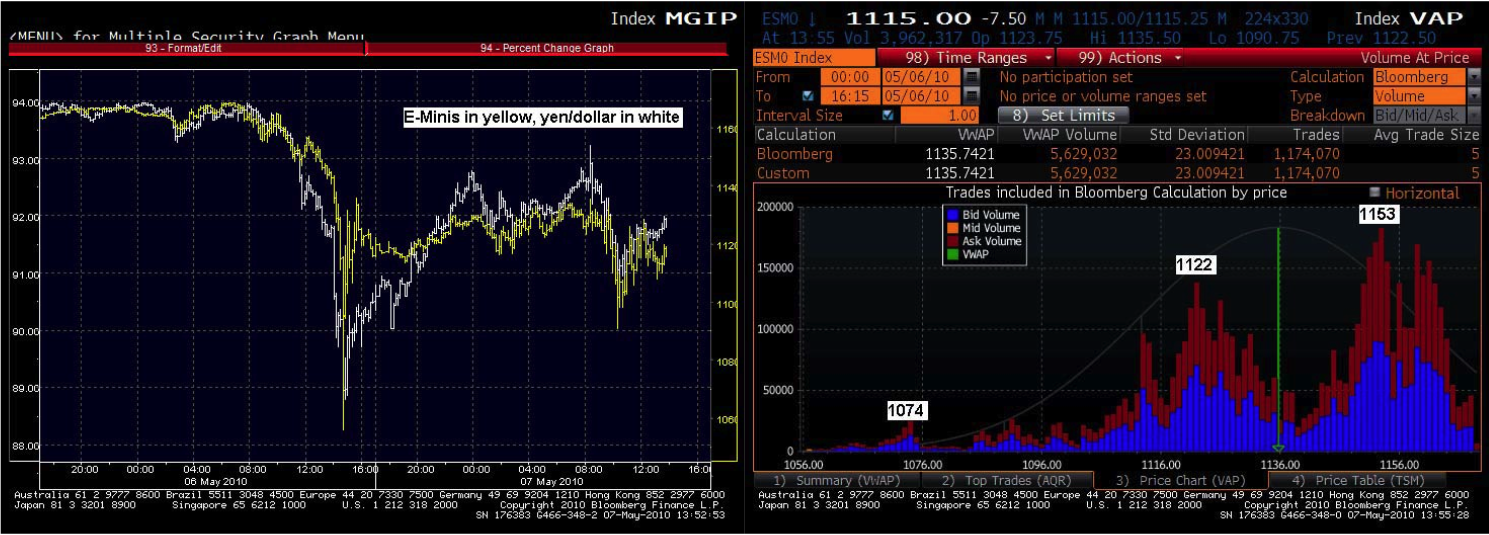
Volume was gigantic [Thursday] before we really went into freefall. As of 2 p.m., some 40 minutes before Armageddon, we were tracking for a massive 15.6 billion share day (we ended up doing 19.3 billion – the second largest day ever after the October 10th, 2008 whitewash). Half an hour later, at 2:30 p.m. – still ten minutes before the bottom fell out – volume had surged and we were tracking for a 17.2 billion share day. The period between 2 p.m. and 2:40 p.m. saw immense selling pressure in both the cash market and the futures market, and that occurred with the E-minis still north of 1120. Check out the below graphs.
>
June 2010 eMini S&P500, NYSE Volume
click for ginormous charts

chart via Bloomberg L.P.
>
In other words, it was not a sudden, random surge of volume from a fat finger that overwhelmed the market. It was a steady onslaught of selling that pressured the market lower in order to catch up with the carnage taking place in the credit markets and the currency markets.
Take a look at the next charts, the chart on the left, which clearly shows the surge in the yen preceding the drop in the stock market.
>
eMini vs Yen/Dollar
click for ginormous charts

chart via Bloomberg L.P.
>
But what about the final thrust lower – the seeming air pocket? We know, thanks to our friends at CNBC who were fixated on this particular stock, that Proctor & Gamble tumbled by over -35% in the span of about 5 minutes. It’s impossible to tell by looking at a chart of the stock, but when you look at the individual prints you can see that this was not a case in which two or three “erroneous” prints marked the tape down to $39 before the stock sprang back to $60. I’ve got 28 pages in front of me of P&G prints that occurred between $39 and $50 per share and between 2:46 p.m. and 2:51 p.m. At 36 prints per page, that means P&G traded over one thousand times at those “crazy” and “surely erroneous” levels. I’m sorry, but that isn’t an error, THAT IS WHAT WE LIKE TO CALL TRADING.
So what happened here? Three things:
1. Sellers probably had orders in algorithms – percentage-of-volume strategies most likely, maybe VWAP – and could not cancel, could not “get an out.” These sellers could be really “quanty” types, or high freqs, or they could be vanilla buy side accounts. It really doesn’t matter. The issue here is that the trader did not anticipate such a sharp price move and did not put a limit on the order. The fact that the technology may have failed does not mean the
trader deserves a do-over, it means that the trader and the broker who provided the algorithm need to decide whether any losses should be split.2. Sell stop orders were triggered which forced market sell orders into an already well offered market.
3. While the market was well offered, it was not well bid. Liquidity disappeared. For example, in P&G, 200 shares traded at $44.10 at 2:51:04 in the afternoon and one second later, at 2:51:05, three hundred shares traded at $47.08. That’s a three dollar jump in one second. Bids disappeared, spreads blew out, and no one was trading except a handful of orphaned algo orders, stop sell orders, and maybe a few opportunists who had loaded up the order
book with low ball bids (“just in case”). High frequency accounts and electronic market makers were, by all accounts, nowhere to be found.
It boils down to this: this episode exposed structural flaws in how a trade is implemented (think orphaned algo orders) and it exposed the danger of leaving market making up to a network of entities with no mandate to ensure the smooth and orderly functioning of the market (think of the electronic market makers and high freqs who can pull bids instantaneously as opposed to a specialist on the floor who has a clearly defined mandate to provide liquidity).
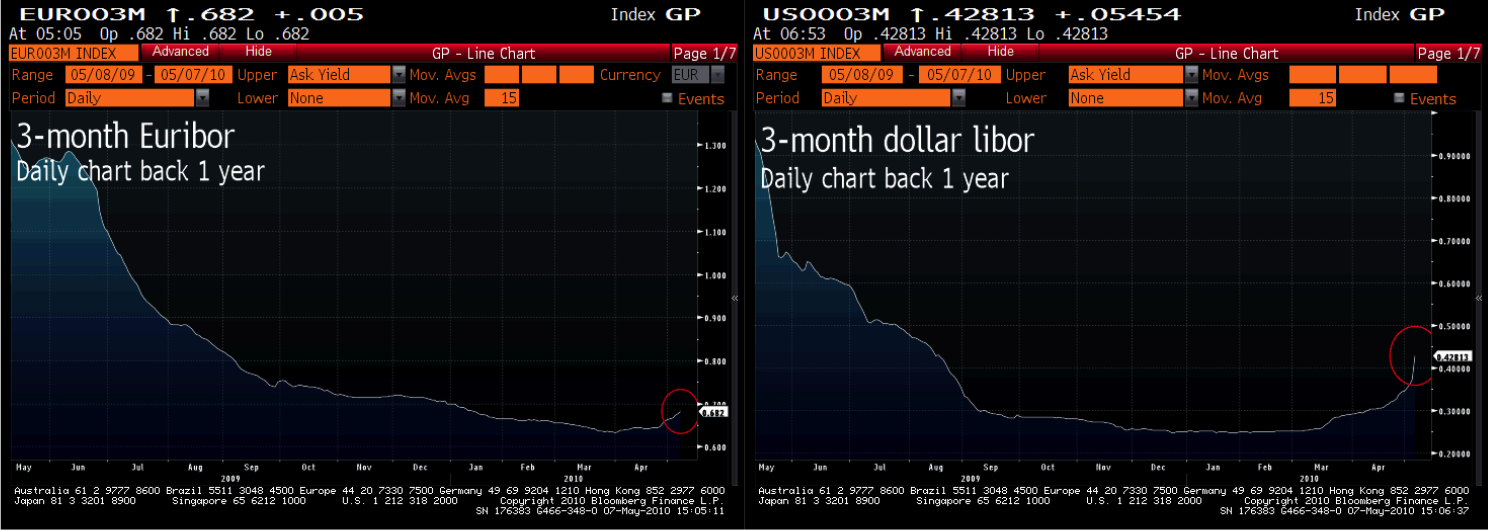
Now that that is settled, we can return our attention to what caused the selling in the first place: Greek contagion. Currently, the euro is rallying on speculation that the European Central Bank is going to announce a reopening of its emergency 1-year funding program for its constituent banks over the weekend. Interbank lending has become more expensive as the perception of counterparty risk has grown more acute.
>
Euribor, Dollar Libor
click for ginormous charts

chart via Bloomberg L.P.
>
A thought here on the ECB’s action: It will likely prove as fruitless in stopping the carnage as the Fed’s liquidity measures taken in the summer of 2007:
• Greek contagion may represent a similar magnitude threat as the subprime debt crisis three years ago. Subprime debt service was contingent upon rising house prices and house prices were going inexorably lower – so the market was doomed, in effect. Peripheral European debt service is contingent upon rising tax revenues relative to government outlays in those countries. Is pulling off this austerity effort without instituting debt deflationary dynamics as doomed as subprime borrowers’ efforts to service their debts three years ago? For Greece and Portugal, it may be.
• If we say that Spain and Italy are not in the same pickle, and that these countries’ debt markets are analogous to the Alt-A mortgage market, maybe the contagion can be quarantined as it could not be in 2007. The X-factor is the growth trajectory of the euro zone and the extent to which that trajectory is depressed by a drop off in Greek and Portuguese demand and by general financial instability in the zone. If growth in Italy or Spain were to falter, they could become subject to the same treatment as Greece and Portugal are currently receiving (I should probably throw Ireland in there somewhere between Portugal and Spain). Like in 2007, it may take several more months before we understand how spikes in libor and euribor have affected European growth.
>


What's been said:
Discussions found on the web: