
Next Super Boom — Dow 38820 By 2025
Stocks Catch Up With Inflation,
But First Inflation Catches Up With Government Spending
Jeffrey A. Hirsch & Christopher Mistal
>
The Great Recession likely ended in the third quarter of 2009. The Great Bear Market of 2007-2009, the second worst of all time, has been stampeded by the current bull. But new highs have not been achieved and the lingering global financial crisis seems to be growing new legs in the Eurozone, rattling the stock market in recent weeks and threatening to cut short the second year of this bull market.
We still expect our 2010 Annual Forecast to pan out, culminating in a more substantial pullback over the next several months, before rallying again into 2011 and 2012, potentially 50% from the 2010 low, whatever that may be. However, like in the two previous secular bears of the 1930s and 1940s and the 1970s and 1980s, we may be in for a few more years of sideways action before reaching new all-time market highs.
Money will still be able to be made, especially for savvy traders who can spot value and take profits. Though we may breach the Dow’s October 2007 high of 14164 over the next few years, we suspect we won’t leave it behind for good until the end of this decade. Several factors lead us to this analysis and a few major developments will need to converge for this to transpire.
For the 2011 Stock Trader’s Almanac, which goes to press this week, we wanted to addresses this long term view and wanted to share a sneak peak with you, our loyal Almanac Investor subscribers. From this Proving Grounds we have created a brand new page based on the analysis discussed here. We will likely continue to revisit and update this study in these pages as developments warrant.
We have dedicated much space and time to this topic and last touched on the phenomenon of how war impacts the market in a blog post on our old blog Pulitzer Material Underscores War & Markets. In our 2009 Annual Forecast we summed it up.
“The single most important non-cyclical influence that has held sway over the stock market is war.… as the new administration takes power, the reality that seven years [now nine years] of foreign conflict may be drawing to an end bodes well for the markets. As the chart illustrates, the market has failed to make any significant headway so long as the country is embroiled in a significant conflagration.
“For detailed analysis refer to the December 2004–February 2005 issues of the Almanac Investor [in the archives]. While we have commented and updated numerous times since the initial publication (which was in fact a reprisal of Yale Hirsch’s original work from 1976) the basic analysis still holds true. The markets have been all but stuck in a trading range since the Iraq War began on March 19, 2003. … While there have been large rallies and pullbacks, there has been no real advance made since 2000. …
“By real advance I am referring to moves that leave the previous highs behind for good – the greater than 500% moves that have historically occurred between all of the major wars the U.S. has been involved in.”
War followed by Inflation, Peace, Secular Bull Market Gains
click for ginormous graphic

chart courtesy of Stock Trader’s Almanac
In the updated chart above the long-term range-bound markets surrounding World War I, World War II and Vietnam are shaded. The long Super booms and bull markets are bracketed with the Dow’s performance. The original analysis was based on the massive inflation caused by government spending related to war. Once the war ended, inflation kicked in and the stock market took off as higher prices, peace and prosperity generated long booms and secular bull markets as we detail in the March Proving Grounds: Nature of the Bull.
Booms & Busts of the 20th Century
As we have watched government spending increase dramatically over the past two years in response to the global financial crisis and The Great Recession, it became clear to us that there is more at play than just wartime inflation coming home to roost. All three previous secular bear markets associated with the three major wars of the 20th Century were also affected by financial crisis that required a great deal of non-war-related spending to stave off . The subsequent booms were driven by peace, inflation from war and crisis spending, and ubiquitous enabling technologies that created major cultural paradigm shifts and sustained prosperity.
The Rich Man’s Panic 1901-1903 and the Panic of 1907 preceded World War I. Henry Ford perfected his automobile assembly line in 1913 as WWI was brewing, but cars did not really begin to replace horses until after the war as the Twenties began to roar.
World War II helped get us out of the Great Depression. But it was not until the rise of the middle class in the 1950’s when our predominantly agrarian society morphed into suburban sprawl during the baby boom and everyone needed a house filled with appliances like TVs, refrigerators, washers, dryers, etc. Roads were built so folks could commute to their jobs in the big city.
As the Vietnam War began to wind down in the mid-1970s, oil crises, Watergate and Mideast turmoil, plunged America into stagflation, that nasty combination of recession and inflation. The advent of personal computers drove the first phase of the last super boom, before the Internet and cell phone fueled the greatest boom since the Industrial Revolution.
The Next Super Boom
The War on Terror may never end, but despite continuing violence in Iraq/Afghanistan, U.S. troop withdrawals remain on schedule. There may be some minor delays as the pace of the withdrawals is being adjusted in response to conditions on the ground, but most combat troops will be out of Iraq this summer and the force is expected to be down to 50,000. Resolution on the formation of a new Iraqi government is necessary before we can be convinced that the U.S. will be able to stick to the plan of having all combat troops out of Iraq by the end of 2011.
Afghan president, Hamid Karzai and President Obama seemed to be more on the same page yesterday as some military and political progress is currently being made in Afghanistan. U.S. troop reductions in Afghanistan remain on schedule to begin in July 2011. Delays will likely alter the actual dates, but the trend and plan remain clear. We are working towards disengaging on those fronts. And this is a crucial component of the Next Super Boom.
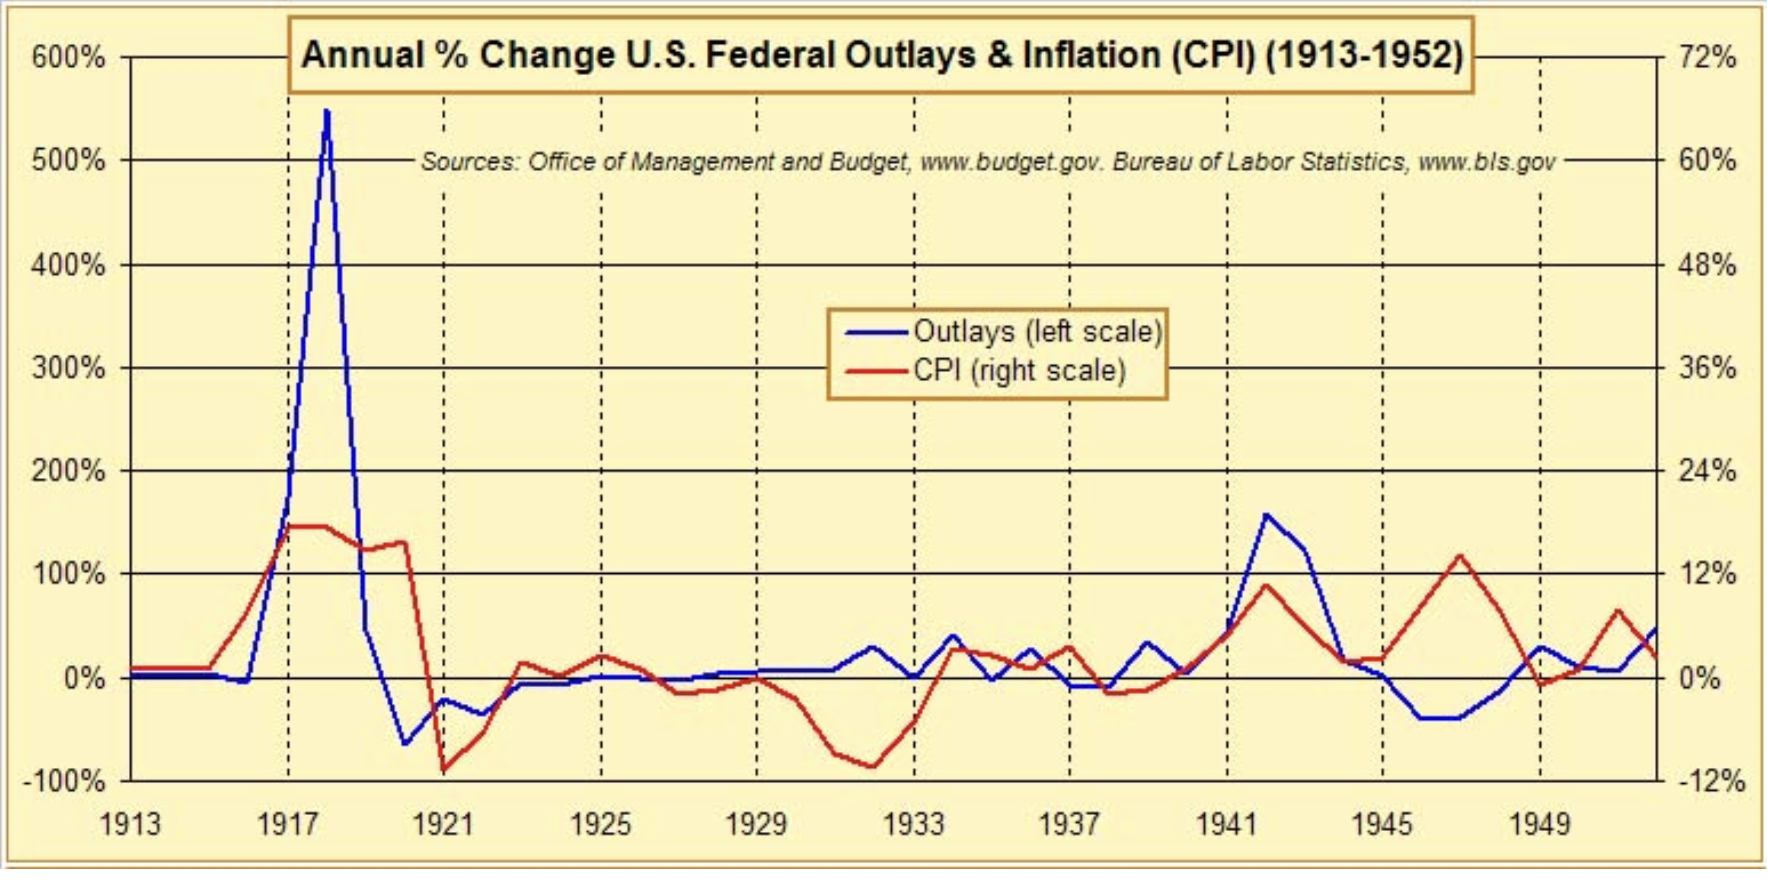
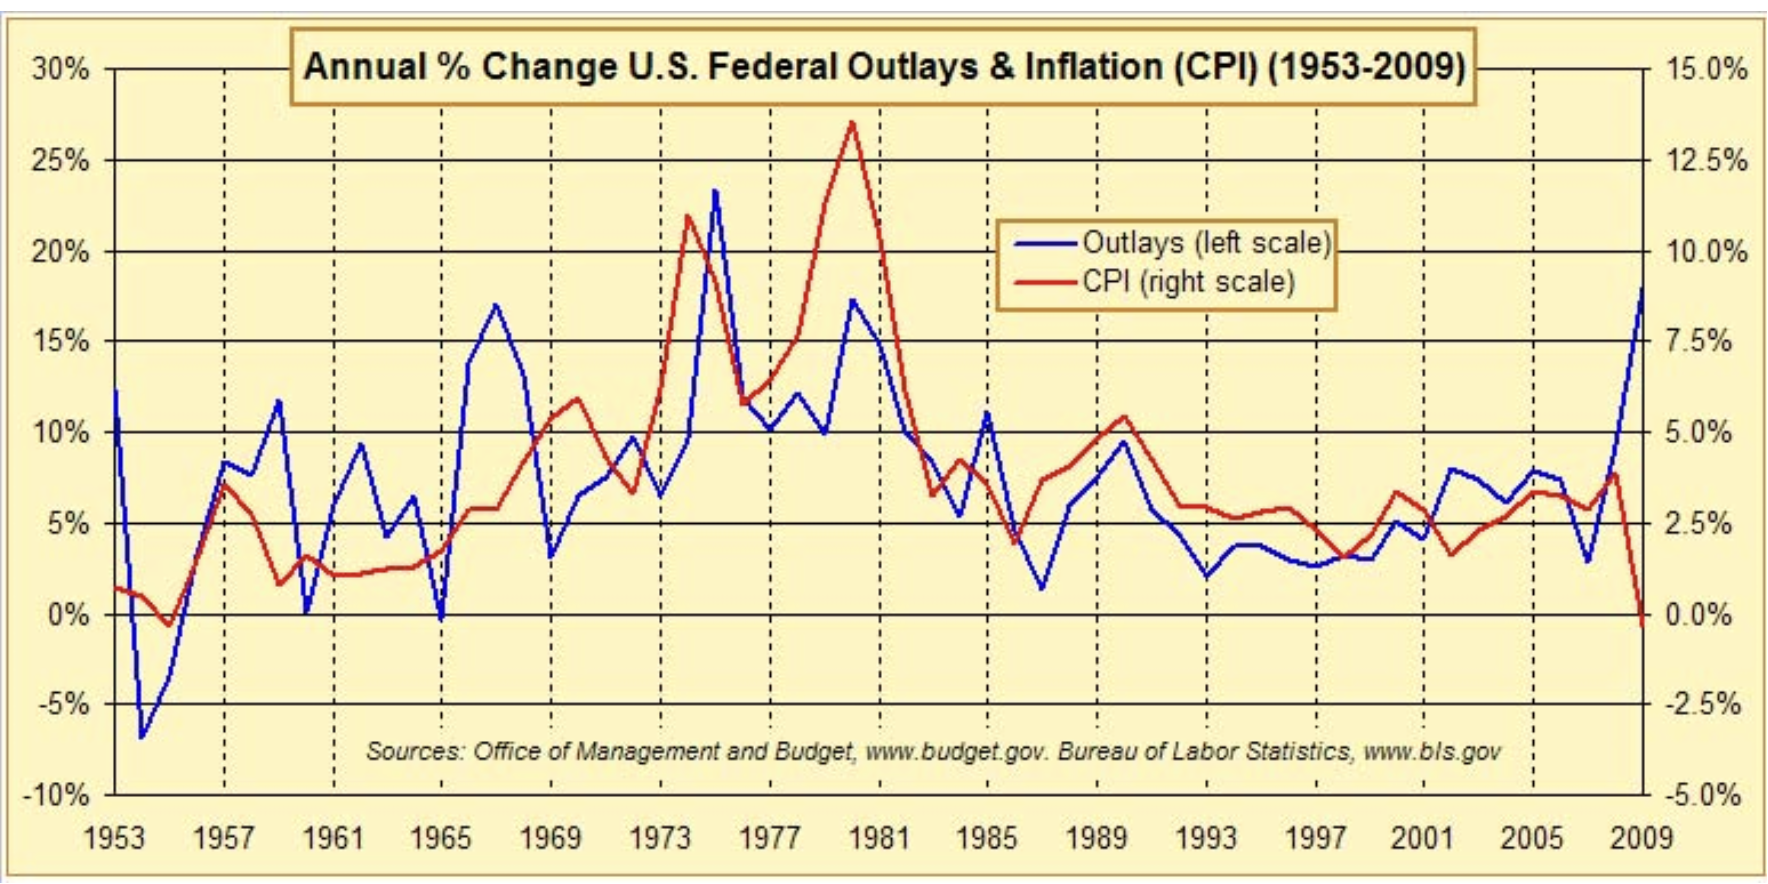
Inflation has not yet materialized and we are still “at war” with government spending on the rise. This has always led to massive jumps in inflation eventually. We expect that it will happen again over the next several years. In the charts below we compare the annual percent changes in U.S. Government spending (outlays) to inflation (CPI). In the 1953-2009 chart you can see the recent pop in spending. We contend that inflation will be right behind it over the next few years.
The final piece in order for the next super boom to come together is enabling technology. We won’t try to claim that we can foresee the future and know for certain what the next enabling technology will be, but we have a couple of ideas. We suspect that the next cultural paradigm shifting technologies will come from Energy Technology and/or Biotechnology.
Oil spills, climate change and high prices are making it more apparent that we need better ways to feed our power-hungry gadgets, homes, vehicles and society. As government initiatives make investment in alternative energy and off-the grid solutions cost-effective, innovation is bound to materialize. Outfitting the planet could generate a boom. Biotech is promising because of all the health issues that exist and the potential it has to impact everyone. Actual cures for diseases opposed to merely treating them would certainly touch every consumer (probably globally). Cancer, heart disease, diabetes—just think of all the money that could be made and all the lives that could be touched.
As markets and economies struggle over the next several years, remember to keep your eye on the future and get ready for the Next Super Boom and the next 500% move in the market. From the last bottom in 1974 it took eight years before the market really took off in 1982 and then another eight to move up the rest of the 500%, in line with Yale Hirsch’s prediction in 1976 for a 500% market move by 1990. A 500% rise in the Dow over 16 years from the intraday low of 6470 on March 6, 2009 would put the Dow at 38,820 in 2025.
~~~
Originally published at Stock Traders Almanac. Reprinted with permission. All rights reserved

What's been said:
Discussions found on the web: