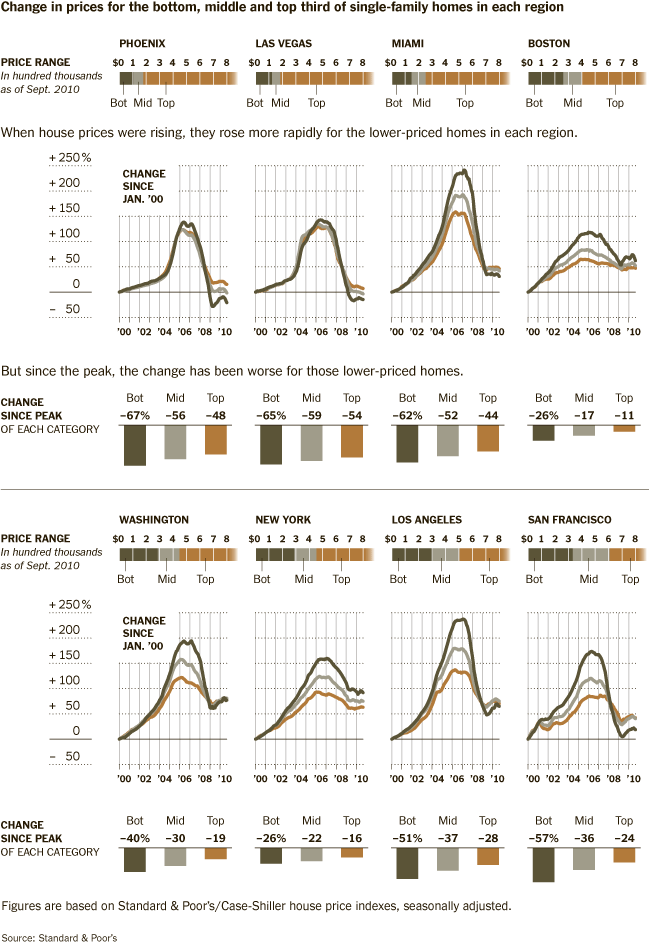
Did the US suffer from a giant Housing bubble?
Not exactly.
In his column this morning, Floyd Norris points to a data point that confirms our long standing argument that the bubble was actually in Credit, not housing. Namely:
“During the great housing bubble boom, it was the least expensive homes whose prices went up the most. And now it is those homes that are suffering the most.
“That is where the most creative lending was,” said David Blitzer, the chairman of the index committee at Standard & Poor’s, arguing that the lax lending standards played a significant role in the inflation of prices.” (emphasis/editing added)
Of course, “Lending” is just another word for credit.
This is consistent with what you would expect from a credit bubble. The higher end homes — often purchased for cash, or with a very substantial down payment — appreciated the least in percentage terms.
The abdication of lending standards during the 2002-07 period had three significant factors in terms of impacting the housing market:
1. The impact of the credit bubble was to allow millions of marginal buyers to enter the housing market. These were borrowers low to middle income borrowers, who under normal circumstances, would not qualify for a mortgage.
2. The homes they purchased were in the bottom quartile (and often bottom tenth) of prices.
3. The credit bubble caused a massive dislocation — to prices, sales volume, even rental vacancies.
Thus, it is not a surprise that the housing sector most dependent upon cheap abundant, indiscriminate lending suffered the most when credit standards reverted to normal.
The data continues to support this thesis. The boom and bust, the price collapses, the underwater homes, and of course, the Foreclosures, are most heavily concentrated in the lower priced homes.
And with the removal of temporary tax credits, lower cost home prices have fallen even further. This week’s Case-Shiller index showed widespread declines in the prices of lower-value homes. Indeed, prices of lower-cost homes have fallen further from the peak in 16 areas tracked by Case Shiller.
And as RealtyTrac noted, the overall housing market is still “gloomy:
• 25% more homes were foreclosed in Q3 vs Q2
• Nonforeclosed homes saw a sequential quarterly sales decline of
29%• $169,523 is the average sales price of foreclosed properties — 32% below the average for nondistressed properties
• 54% of Nevada home sales were foreclosures in Q3 — worst in the nation
(Source: RealtyTrak, Barron’s)
As goes the low end of the market, so goes all of housing . . .
>
click for ginormous graphic

Chart courtesy of NYT
>
Source:
Value Sinking Fastest on Homes Priced Low to Start
FLOYD NORRIS
NYT, December 3, 2010
http://www.nytimes.com/2010/12/04/business/economy/04charts.html


What's been said:
Discussions found on the web: