I was speaking with a friend who asked why 48% — why not 100% cash?
The short answer is that we are seeing some signs of a pullback, but not necessarily anything more ominous. Additionally, the 3rd year of a Presidency has lots of tailwinds in it for the markets.
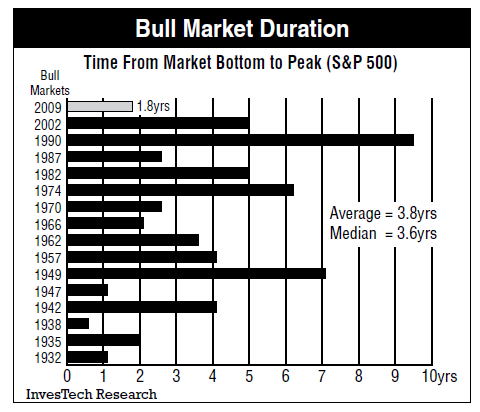
But the longer answer is a bit more nuanced. Have a look at the chart and table below, from Jim Stack of Investech Research. The Bull Market Duration chart shows that in terms of overall rallies, the present run is not too long in the tooth. This present run is not yet two years old, about half of the average length of rallies over the past century. I read this as suggesting longer term investors can stay long(ish), so long as they have risk discipline in place:
>
>
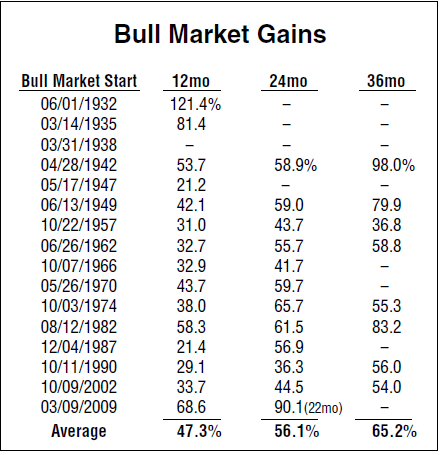
My concerns are a bit more over the short term. The second table shows just how fast and far this market has run.
At 90% gains, this market has run further and faster than any previous rally. Indeed, in just 20 months it has far outpaced every other rally’s 24 month record by some 50%; the next closest gainer was 65.7% . That does raise some cause for concern short term:
All charts and tables from Investech Research


What's been said:
Discussions found on the web: