UPDATE DEUX: Heritage has now revised its numbers — see post above at 18:13 Eastern.
UPDATE: Apparently, in one document that can be found here, Heritage has simply disappeared the line item in which the unemployment rate falls to 2.8 percent by 2021. The document states: “Updated as of April 6, 2011 at 11:04 a.m. EST,” which update was presumably the removal of the unemployment rate projections. At this moment (13:30 Eastern), it still appears — for now — in this document (which I have saved in multiple spots). It is, frankly, remarkable to me that they would take such an action. Apparently when one’s analysis does not stand up to even the most cursory examination, the solution is simple: Delete the offending data.
Invictus here, folks. Filling in a bit for our traveling host with a side-by-side glimpse of our competing budget plans.
Paul Krugman has very recently written here and here about some improbable aspects of the Ryan budget proposal. In that vein, I thought it might be instructive to take a look at some of the similarities and differences of forecasts in Obama’s forecasts projections versus those being offered by Ryan.
What I have done in each case is as follows: I downloaded the appropriate series from the St. Louis Fed (or in one case BEA.gov), always on an annual basis. In almost all cases I made what I believe is a reasonable assumption for 2011 to bridge me from known 2010 (and prior) historical data to 2012 and beyond forecasts. Those assumptions are noted. I then simply took forecast numbers from the Heritage Foundation’s analysis of the two plans (the forecasts are in Appendix 3). Any input errors in creating the charts below are solely my fault, though I endeavored — under my noon deadline — to enter everything as accurately as possible. Please note any errors in comments.
(Click through any image for larger.)
First up, Real GDP. (FRED Series identifiers appear on most charts.)
Moving on to the Unemployment Rate:
So the proposed Ryan budget is going to reduce the unemployment rate to a historic — at least on an annual basis — low of 2.8 percent by 2021. And although that would have to be considered full employment and a taut labor market by just about anyone’s standards, we will see little or no impact on wages and/or inflation (beyond what Obama forecasts). In fact, the Ryan and Obama forecasts are almost literally on top of each other when it comes to inflation — but then Obama is not forecasting a 2.8 percent unemployment rate. In fact, his forecast is for almost twice that (5.2 percent at best). Honestly, is it possible to take seriously a projection that we are going to get the unemployment rate down to 2.8 percent by 2021 (or, actually, any time, for that matter)?
You literally cannot see Obama’s inflation forecast because Ryan’s sits atop it.
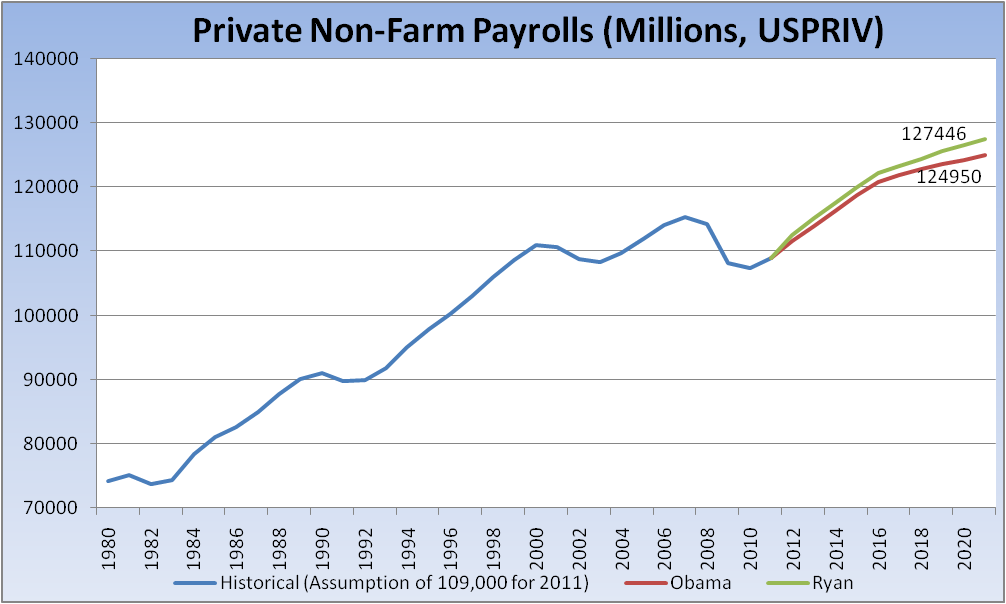
So let’s move on to jobs. How much more robust will the jobs market (private payrolls) be under Ryan’s numbers than Obama’s?
So the Ryan plan will produce about 2.5MM more private payroll jobs — about 21,000/month above Obama — over the next 10 years. I’m not sure how that translates into a 2.8 percent unemployment rate. (In the spirit of current sentiment, I assume not a single government worker will be hired in the next 10 years, at least, and therefore will not look at overall non-farm payrolls.)
Here are private sector wages and salaries followed by real disposable income. I would have thought a 2.8 percent unemployment rate would produce some discernable wage inflation beyond what we see below:
Unfortunately, it does not appear that the Ryan plan does anything meaningful on the one line item that matters most to the vast majority of Americans — Real Disposable Income – again, the lines are virtually on top of each other.
Presumably because this is a much more serious proposal that will get our house in order, Ryan’s plan forecasts lower rates on the 10-year note than Obama’s. The bond vigilantes will be held at bay as some $6 trillion is cut from the budget, or something like that.
The Heritage analysis contains comparisons on many more metrics than I’ve presented above; I simply chose a few that I thought might be of most interest. I may make further comparisons as time permits.
In wrapping this up, let me state for the record that I think virutally all forecasting beyond about 24 months — in almost any discipline — is generally an exercise in futility (of course there are exceptions). That said, the integrity and viability of what’s put before us always warrants some scrutiny and should be at least given the sniff test.


What's been said:
Discussions found on the web: