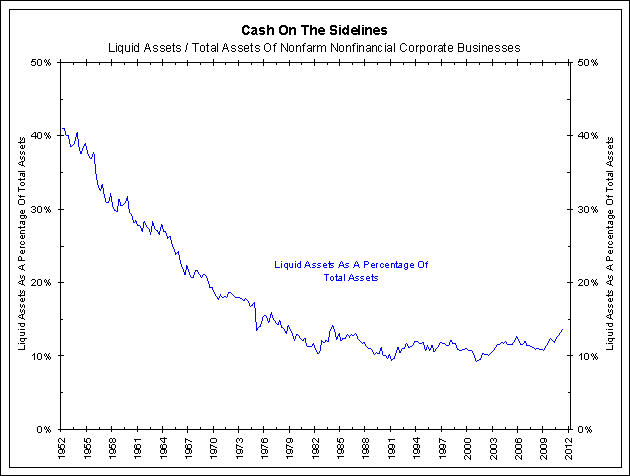
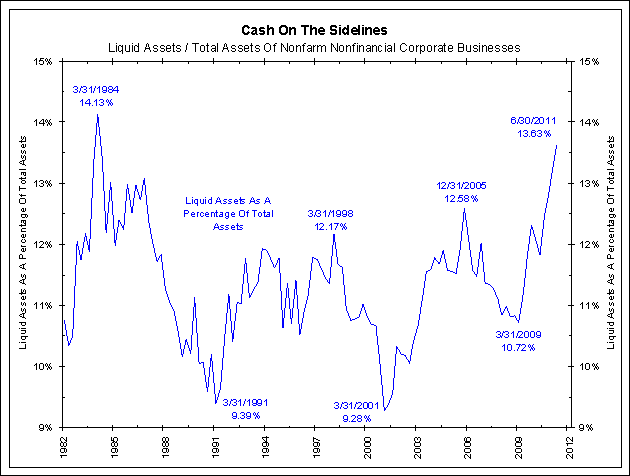
On Friday the Federal Reserve released its quarterly Flow of Funds data, current through June 2011. One of the more popular headlines from this data concerns the record amount of “cash on the sidelines“. Through Q2 2011, nonfarm nonfinancial corporate businesses held $2.05 trillion in liquid assets on their balance sheets. As the argument goes, this must be a sign of pent-up demand just waiting to be unleashed on the market. The second chart below illustrates why this may not necessarily be the case.
Liquid assets held on companies’ balance sheets is a nominal number, much like the nominal level of GDP, that rarely decreases. Of course cash on the sidelines is at a record nominal level, it usually is. This series must be compared to other balance sheet items for relevance. The chart below shows liquid assets as a percentage of total nonfarm nonfinancial corporate business assets since 1952. By this measure, the “cash on the sidelines” argument is far less compelling.
Even when examined over a shorter time frame, as shown below, the percentage of cash on the sidelines is still within its range of the past 30 years. While liquid assets have certainly increased relative to the rest of corporations’ assets since the end of 2008, the idea of record levels of cash just waiting to invest in the markets is not evident when viewed in this manner.
Source:
Bianco Research, LLC.
September 20, 2011


What's been said:
Discussions found on the web: