As expected, the (second) Greek bailout is now approved (WSJ, NYT, Bloomberg, FT.com).
This rescue plan was widely expected — negotiations had been ongoing for several quarters (seems like years) and so a massive reaction is unlikely. Indeed, European Bourses opened positively then slipped modestly into the red. US futures are modestly higher.
Watch for a rally up thru 13,000, a possible pullback and consolidation, then more upwards movement.
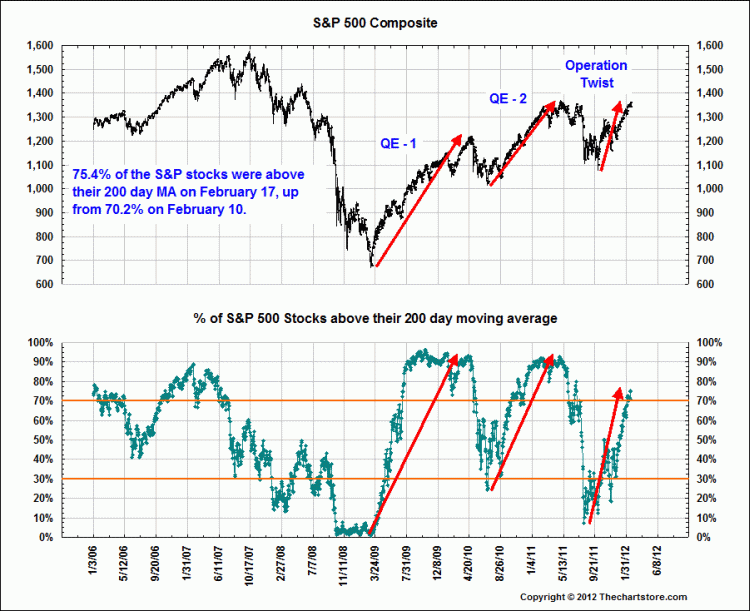
Why is this? On occasion, big events can trigger pivot points in markets. Consider the downgrade of the US credit rating by S&P in Augusts 2011 — markets sold off, Bonds rallied. Then Operation Twist was introduced, and markets got excited again.
That is no coincidence. When we look at markets from a technical perspective, we see that they often run from overbought to oversold and back again. Lets use percentage of S&P500 stocks over their 200 day moving average as an example (See chart below). This is not a precise timing tool — it merely indicates how oversold we are at any moment.
It is no coincidence that when markets are extremely oversold, it induces government and central bank actions. Sometimes this results in intelligent policy, sometimes it looks like panic. Regardless, we can see how the deep oversold condition led to changes in policy that added liquidity to markets — one source of fuel for market rallies.
The post credit crisis sequence seems to operate thusly: Markets slide lower on weak fundamentals. They accelerate down on stop losses and risk management. They plummet on panic. Then intervention of some sort occurs. The experienced market/Fed watchers know the impact, and jump in. As markets move off lows, some value types, cycle historians, and then technicians jump on board. The rally may be distrusted or even hated, but eventually trend followers then momentum boys join the party. Pretty soon, its all aboard the Love Train, and not too long after, markets reach their over bought condition. The cycle begins anew.
The March 2009 lows brought QE (some argue that QE brought the March 2009 lows, but that is getting the psychology backwards). It took less than 200 points of SPX losses and some punk economic data and fears of a double dip to give us QE2. Fears of an entirely separate recession (credit ECRI) and a 300 point, near 20% SPX tumble gave us Operation Twist.
If the past is prologue (and that cannot be relied upon), we could see a scenario something like this (Note: Wild ass guessing to follow). Markets kiss 13,000, pullback and consolidate. But they are not overbought sufficiently for anything more serious than a modest retracement, and so they continue higher for several months, until the % of stocks over 200 day MA is near 90% (they are at 75% today). That takes us somewhere between March and June. The next sell off begins, lopping 25% or so off of the SPX. The Federal Reserve waits until after the November election to introduce QE3, and the cycle starts anew.
What could derail this? An improving economy could postpone QE3 indefinitely. Fading profits could move the timeline up rapidly (S&P 4Q shows only 54% beat on EPS).
Regardless, the market picture for the next few months is going to be driven by the answers to the following questions: Is economic data confirming a recovery? Are profits at peak levels? Will the Fed sit tight or act?
Your expectations for the answers to these questions very likely determines your investment posture. Adjust accordingly.
>

Source: The Chart Store


What's been said:
Discussions found on the web: