One measure of a successful monetary policy is its ability to anchor expectations about future inflation rates. Financial crises, such as that of 2008–09, can be considered natural experiments that test this anchoring. The effects of the crisis on inflation expectations were largely temporary in the United States, but longer-lasting in the United Kingdom. That is surprising because the United Kingdom had a formal inflation target during this period. Expectations may have been affected more because inflation stayed above the central bank’s target for extended periods following the crisis.
Beyond keeping current inflation low, successful monetary policy is also able to manage expectations about the future rate of inflation. A major financial crisis, such as that of 2008–09, can be considered a natural test of this anchoring. This Economic Letter examines how household inflation expectations have evolved since the beginning of the financial crisis in the United States and the United Kingdom. In the United States, long-term expectations have been well behaved relative to short-term expectations since the crisis began. By contrast, in Britain, both short- and long-term inflation expectations have been elevated.
The data and some summary measures
In both countries, household surveys ask about the rate of inflation expected over the coming year and the longer term. U.K. data come from the Bank of England’s quarterly Inflation Attitudes Survey. The Bank asks approximately 2,000 households what inflation rate they expect one year, two years, and five years ahead. We focus here on the one-year and five-year-ahead responses. The Bank has been asking about year-ahead expectations since the survey began in 1999 and about five-year-ahead expected inflation since early 2009.
The U.S. data are from the Thomson Reuters/University of Michigan Surveys of Consumers. Each month, the survey asks a random sample of approximately 500 households what changes they expect in key macroeconomic variables, such as inflation, interest rates, and unemployment. Respondents are asked their inflation expectations over the next 12 months, and 5 to 10 years out. We refer to the latter as five-year-ahead expectations for ease of comparison with the U.K. data.
Both surveys ask consumers to forecast the rate at which prices will change. They do not ask for forecasts of the rate at which any specific price index will change. This is a subtle but important difference because central banks use a specific price index to measure the inflation rate. The Bank of England has a 2% inflation target as measured by the U.K. consumer price index (CPI). The Federal Reserve measures U.S. inflation according to the personal consumption expenditures price index and announced a 2% inflation target last January. Consequently, a direct comparison between expected inflation levels in the two countries could be misleading. Instead, we examine the behavior of long-term inflation expectations relative to short-term expectations in each country, and compare the patterns in the two countries.
We use the median to measure the central tendency of inflation expectations. The median represents the middle observation of the survey. In half the responses, expected inflation falls below the median. In the other half, expected inflation falls above it. The median doesn’t take into account how much inflation expectations vary across respondents.
To measure the dispersion of inflation expectations, we calculate what is known as the interquartile range. Respondents are divided into two groups, based on whether they expect inflation to be above or below the median. We then calculate the median for both of these groups. To get the interquartile range, we subtract the smaller median from the larger one. As inflation expectations become more dispersed, this measure becomes larger.
Economists have debated how the dispersion of expected inflation should be interpreted. Some argue that it is a measure of uncertainty. Others interpret it more literally as simply a measure of disagreement. For instance, consumers may be certain that the central bank will hit its inflation target. But they may differ in the inflation target they believe the central bank is aiming for. This debate is not important for our purposes. From the standpoint of inflation target credibility, consumers disagreeing about the central bank’s inflation target seems just as problematic as consumers feeling uncertain about the central bank’s commitment to its target.
There will always be some dispersion of inflation expectations. For instance, different consumers buy different baskets of goods. Thus, it is likely they will experience different rates of inflation. Such consumer heterogeneity is a reason for dispersion, but not the only one. The central bank’s ability to anchor inflation expectations may also affect dispersion, which means the interquartile range can provide useful evidence about the bank’s success at anchoring.
The U.K. experience
Figure 1
U.K. median inflation expectations
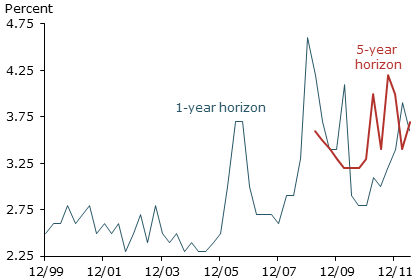
Figure 1 plots the median one-year and five-year-ahead expected inflation for Britain. Median year-ahead expected inflation was relatively well behaved prior to 2007, generally staying between 2 and 2.5%. It rose slightly above this level in 2007 and jumped sharply in 2008, partly in response to rising oil prices. It then collapsed following the financial crisis. Figure 3 shows this pattern is similar to the path of U.S. household inflation expectations.
Since the financial crisis, one-year-ahead inflation expectations in the United Kingdom have risen noticeably above their pre-2008 level. Between 2000 and 2009, year-ahead expected inflation averaged 2.5%, including the sharp rise in the first half of 2008. Since 2009, it has averaged 3.4%, almost one percentage point more. Actual CPI inflation has also risen during this period, remaining more than one percentage point above the Bank of England’s 2% target for extended periods.
Of course, in the short run, factors outside the control of monetary policy, such as spikes in commodity prices, affect the inflation rate. Even if it were possible to completely offset the effects of these shocks, trying to do so would probably impose significant costs on the economy. However, over the long term, inflation is determined by monetary policy. That is why Bernanke, et al. (2001) argue that a comparison of long-term expected inflation and the central bank’s inflation target provides information about the bank’s credibility.
Such a comparison using the data in Figure 1 shows a divergence between long-term inflation expectations and the Bank of England’s 2% target. In recent surveys, five-year-ahead median inflation expectations range from 3 to 3.5%. Since the five-year question was first asked in 2009, one can see an upward trend in median inflation expectations similar to that in year-ahead expected inflation. The upward trend in five-year-ahead inflation is not very pronounced. But it does suggest that the financial crisis and its aftermath have pushed long-term inflation expectations higher in the United Kingdom.
Figure 2
U.K. interquartile range of inflation expectations

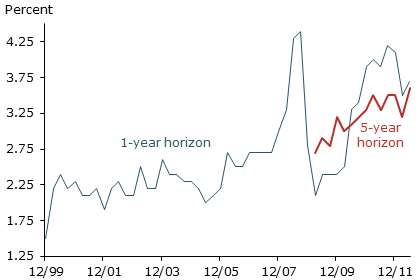
Figure 2 shows dispersion as measured by the interquartile range. As in Figure 1, the pattern is different after the middle of the decade, and the dispersion of year-ahead inflation expectations increases noticeably during the financial crisis. More surprisingly, the dispersion of five-year-ahead inflation expectations in recent years appears to be roughly similar to the dispersion of year-ahead expectations. This is troubling. As noted earlier, monetary policy is mainly what determines inflation over the long run. Hence, if the central bank’s inflation target is credible, it is not clear why long-run inflation expectations should be as dispersed as short-run expectations. Whether we think of dispersion as an expression of uncertainty or disagreement, over a long-term horizon, expectations should tend to converge on the central bank’s stated inflation target.
The U.S. experience
Figure 3
U.S. median inflation expectations

Figure 3 shows U.S. median expected inflation rates. For this analysis, we adjust the U.S. survey’s frequency from monthly to quarterly to match the British survey. The volatility of one-year-ahead expectations is noticeable. Some of this volatility reflects sharp swings in oil prices (see Trehan 2011). By the end of the sample, year-ahead inflation expectations are significantly lower than the levels registered in late 2008. They lie roughly in the middle of the 3.5 to 4% range seen in the three or four years before the oil price run-up and the financial crisis.
Figure 3 also shows the median inflation that U.S. households expect in 5 to 10 years. This measure also moved up somewhat following the oil price jump in 2008 and remained elevated through the financial crisis. But, since early 2010, 5- to-10-year expected inflation has stayed in a relatively narrow range around 3%. Especially noticeable in Figure 3 is the stability of the five-year-ahead measure compared with the year-ahead measure.
Figure 4
U.S. interquartile range of inflation expectations

Figure 4 plots the interquartile range of U.S. household inflation expectations. An unusually large increase in the dispersion of year-ahead expectations occurred following the oil shock, and dispersion remained quite high for several years. The contrast with the dispersion of long-term inflation expectations could not be more obvious. In 2008, the interquartile range for year-ahead expectations jumped more than three percentage points. But, for five-year-ahead expectations, it increased only a few tenths of a percentage point.
Taken together, Figures 3 and 4 suggest that even such a severe shock as the financial crisis did not significantly change U.S. household long-run inflation expectations. It’s worth recalling that, for most of the period of this study, the United States had no formal inflation target. It will be interesting to see what effect the formal target will have on U.S. inflation expectations.
Possible reasons for the difference between countries
Why do our measures of long-term expected inflation lie closer to the short-term measures in Britain than they do in the United States? Put another way, shocks to the economy can cause one-year inflation expectations to differ from the central bank’s target. But this difference should diminish over longer horizons if inflation expectations are well anchored.
The short span of U.K. five-year expected inflation data make it impossible to do a statistical analysis that would help explain why long-term inflation expectations have diverged in the two countries. However, Trehan (forthcoming) offers one possible explanation. The paper, based on an analysis of University of Michigan consumer survey data, argues that households place an inordinate weight on recent inflation when forming inflation expectations. Broadly speaking, U.K. median expected inflation data appear consistent with this hypothesis. Over the past three years, British inflation has averaged 3.5%. And that is about where five-year-ahead inflation expectations have moved over this period. If households are indeed backward looking, then the increase in expected inflation in the United Kingdom is not particularly troublesome. When reported British inflation falls, as it seems to be doing, so will expected inflation.
But this does not explain the relatively high disagreement among households. It’s possible that not all households are backward looking. Over the past two decades, central banks have tried to improve the communication of their policies and forecasts in an attempt to better manage expectations. Some households may be considering the central bank’s words as well as its recent record in keeping inflation on target. The more the words and the record are at odds, the more room there is for a wider range of interpretations about the central bank’s actual, as opposed to its stated, inflation target.
Source: FRBSF Economic Letter


