Click for ginormous chart

Source: Bianco Research
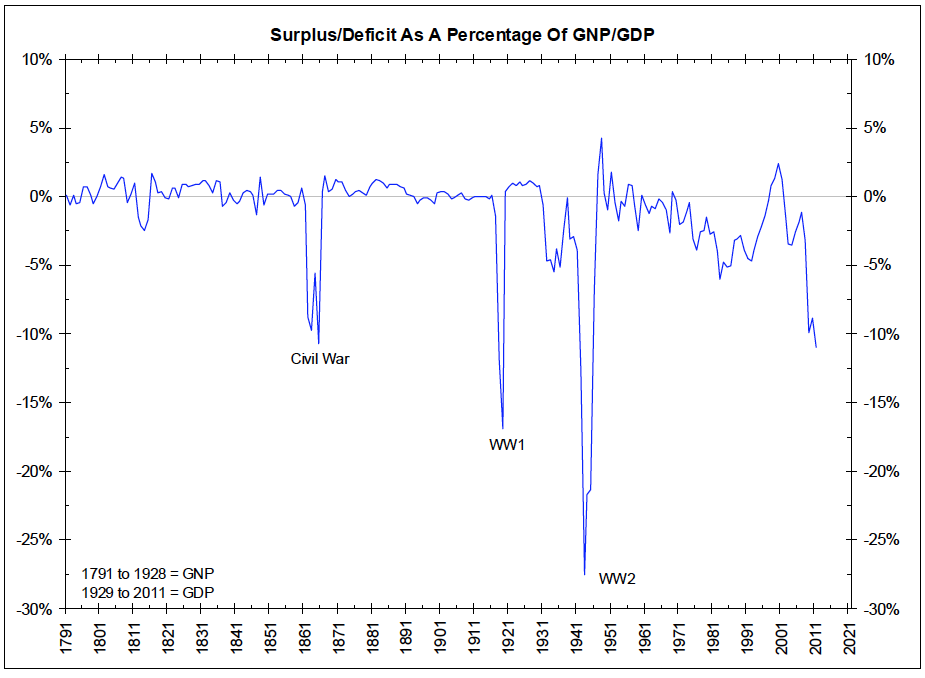
Since we are debating the deficit, debt and upcominn sequester/tax expiration, lets take a closer look at the history of the American Surplus & Deficits over time.
As you can see, going wildly into the red or black was common in the days before an income tax existed in the 19th century.
The 20th century saw the two world wars and the great depression as sources of spiking deficits relative to GDP.
Note the trend that began in the 1970s, accelerated in the 1980s and did not reverse til the late 1990s, only to start again in the 2000s.
What occurred over these eras?
The deficit eras were during the 1970s when the US went off the Gold Standard, the 1980s, during a period of huge unfunded tax cuts and massive military build up; the 2000’s saw more unfunded tax cuts, post 9/11 homeland security spending, rising military spending for 2 wars, additional domestic spending under Bush, then the financial crisis, the Obama stimulus, and even more defense spending and unfunded tax cuts and extensions.
The surplus was during the late 1990s when there was an economic boom accompanied with rising taxes.
~~~
Surplus/Deficit As A Percentage of total debt after the jump


What's been said:
Discussions found on the web: