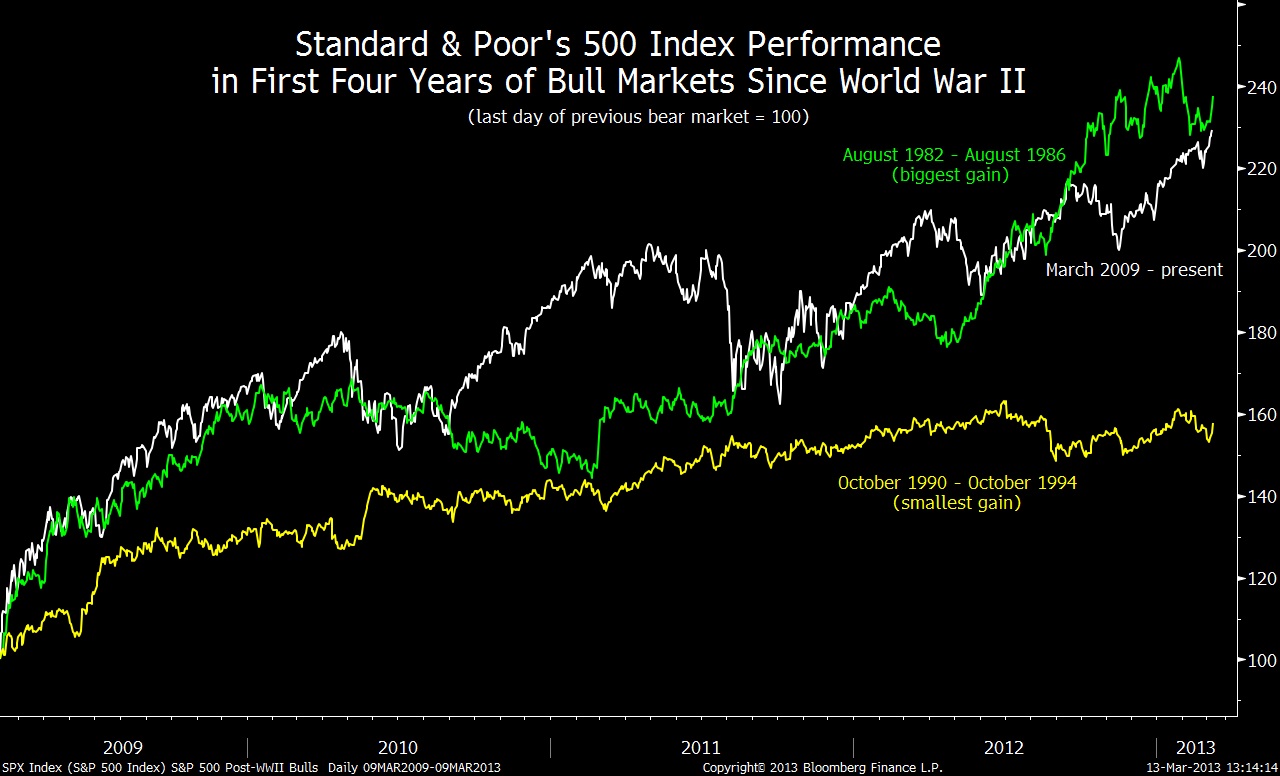
How have markets done in the 5th year of a bull run?
The chart above comes from Jeffrey Kleintop, LPL Financial’s chief market strategist. The bull market that began in March 2009 is the seventh to last at least four years since World War II. Of those seven, only four ran for five years or more, with an average gain of 22%. The four-year gains ranged from 58% in October 1990, to 138% in August 1982.
Before getting too excited, note that this is an exceedingly small sample set, one that is barely better than even money (57%).
One other noteworthy factoid: David Wilson of Bloomberg notes that two and one half months into the new year, “the S&P 500 has yet to retreat for more than two days in a row this year.”
That is a helluva streak just begging to be broken . . .
Source:
Chart of the Day
David Wilson
Bloomberg March 13


What's been said:
Discussions found on the web: