Forward Markets: Macro Strategy Review
Jim Welsh, David martin, Jim O’Donnell
Macro Factors and Their Impact on Monetary Policy,
The Economy and Financial Markets
U.S Economy
According to the Commerce Department, GDP slipped -.1% in the fourth quarter. Although growth certainly slowed in the fourth quarter, the GDP report overstated the degree of weakness and was impacted by a number of special factors. Defense spending sank at a 22% annual rate which contributed to an overall drop in government spending of 15%. 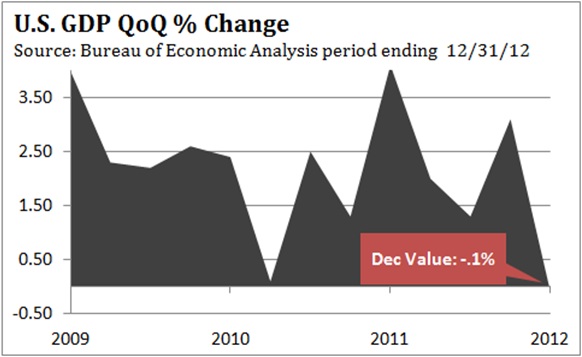 This was the steepest decline in 40 years and subtracted 1.33% from fourth quarter GDP. In anticipation of the fiscal cliff, businesses reduced inventories significantly, which sliced 1.27% from GDP. The drawdown in inventories is actually a silver lining since businesses are likely to rebuild inventories in the first half of 2013, adding to GDP growth. Importantly, final demand grew 2.3% as consumers and business spending held up despite the looming fiscal cliff. The fact that consumer spending added 1.52% to GDP doesn’t surprise us since the majority of American consumers are not economically tuned in. If asked, many would guess that the fiscal cliff was a new reality show. But business investment jumped 8.4% and investments in equipment and software surged 12.4%, showing more confidence than we expected. The bottom line is that GDP will be revised upward by .5% to 1.0%. Not great, but better than a negative reading.
The labor market also improved in the fourth quarter, as job growth averaged a monthly gain of 200,000 new jobs, versus 150,000 in the first nine months of 2012.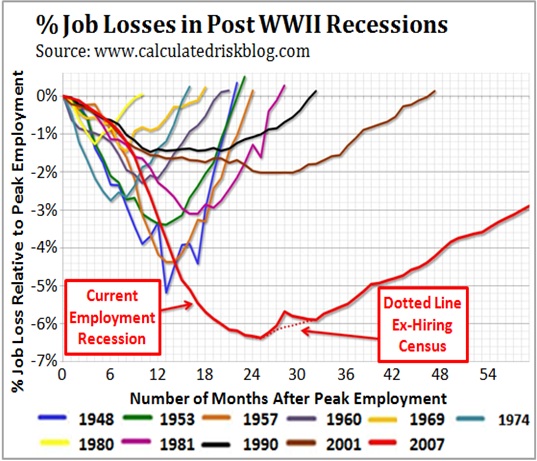 Average weekly earnings rose 1.9%, continuing to grow less than the cost of living. Adjusted for inflation, wages have fallen for 21 of the last 23 months. The 2% increase in the social security tax will effectively wipe out the increase in weekly earnings over the last year. The labor market remains woefully weak for this stage of a recovery. Comparing the recovery since 2009 with the 10 prior recoveries since World War II is revealing. In nine instances, all the jobs lost during the recession were recovered within 32 months of the recession’s end, while it took 47 months to recover the jobs lost after the 2001 recession. Despite the improvement in job growth during the fourth quarter and after 58 months of recovery, there are 3% fewer jobs than in December 2007 when the recession began. (chart www.calculatedriskblog.com) This short fall represents 3.3 million jobs (138,143,000 versus 134,800,000), but doesn’t take into account 5 years of population growth or the ramifications of such weak employment growth.
In addition to the unemployment rate, the Bureau of Labor Statistics tracks the number of workers who are working part-time because their employer has cut back their hours or are 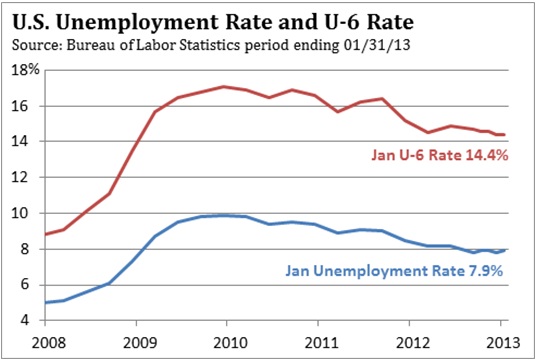 unable to find full-time employment. The BLS estimated there are 8 million people who are unsatisfied part-time workers, and another 10 million discouraged workers who have given up looking for a job or are just “marginally attached” to the labor market. This broader and more comprehensive view of the labor market by the BLS pegs the combined unemployment and underemployment rate at 14.4%, which is 82% higher than the ‘official’ 7.9% unemployment rate. This widespread weakness is also reflected in the growth of other government assistance programs. Between 1970 and 2000, 7.9% of American benefited from the food stamp program. Today 47.5 million Americans (15%) depend on food stamps, an increase of 90% above the 1970-2000 average and up 47% from the 32.2 million in 2009. Laid off and unable to find work, more than 5 million people have signed up for social security disability, even though the safety of the American workplace has never been safer. With 11 million Americans now receiving social security disability, there are only 16 workers for each recipient, up from one worker on disability for every 35 workers in 1992.
Given human nature we have no doubt that a small percentage of people on government assistance programs are milking the system. The more important point is that absent these safety nets the “Great Recession” would have been deeper. The balancing act of paring the need for and dependency on these programs while reducing the Federal budget deficit will be difficult, but necessary.
According to the Census Bureau, 60% of people living below the poverty line didn’t work last year. Raising the minimum wage will not lift them out of poverty since they need a job. The Bureau of Labor Statistics estimates that almost 40% of those working for the minimum wage live with a parent or relative. The poverty line for a family of four is $23,550, but the average family income for a household with a minimum wage worker is $47,023. After reviewing more than 100 studies on the Federal minimum wage, economist David Neumark from the University of California, Irvine found that 85% of the studies “find a negative employment effect on low-skilled workers.” For instance, a small business with 18 employees making minimum wage will have an annual payroll of $261,000 ($7.25 x 2000 hours x 18). If the minimum wage is increased 24% from $7.25 to $9.00, this small business owner’s annual payroll expense will increase from $261,000 to $324,000. In response, the owner will likely cut the hours for every employee, layoff 1, 2 or 3 employees, and work more hours themselves to make up the difference. This should be obvious, but to bureaucrats who have never run a business or met a payroll, it isn’t.
The increase in the minimum wage will not achieve its stated goals and will likely be a net negative for job retention and job growth. The most misguided aspect of this proposal is that the government has had a program in place since 1975 that is more effective in boosting income for working low-income families. The Earned Income Tax Credit Program supplements wages for low income workers without putting their jobs or incomes at risk, as the increase in the minimums wage does. The EITC was created by President Ford in 1975 and has been increased by presidents of both parties since then, including President Obama in 2009. A full-time minimum-wage worker who earns $14,500 will receive an additional $5,000 from the EITC, and pays no Federal income tax on the income of $19,500. In addition, 24 states offer an additional credit, usually as a percentage of the Federal credit. If the goal is to boost the income of hardworking Americans at the lower end of the income scale, expanding the Earned Income Tax Credit has been more effective and less harmful than an increase in the minimum wage.
In 2012, the Energy Information Administration estimates the average U.S. household paid $2,912 for gasoline. 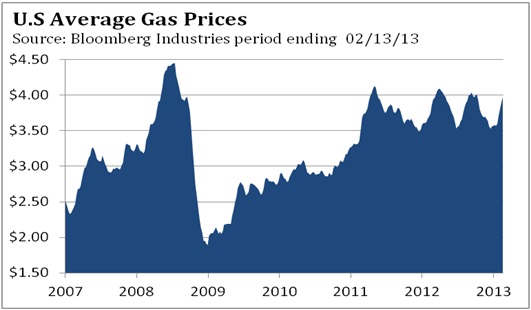 With median income near $50,000, 5.8% of the average family’s income went toward keeping their cars running last year. With the exception of mid 2008, that’s the highest percentage in three decades. Through the first six weeks of 2013 even more family income is being guzzled. Since December 20, unleaded gas has climbed from a nationwide average of $3.21 to $3.78 as of February 19 and risen for 33 consecutive days, according to the Oil Price Information Service. If these price levels are maintained throughout 2013, this jump of 17.7% could cost the average family $400 beyond what was spent in 2012.
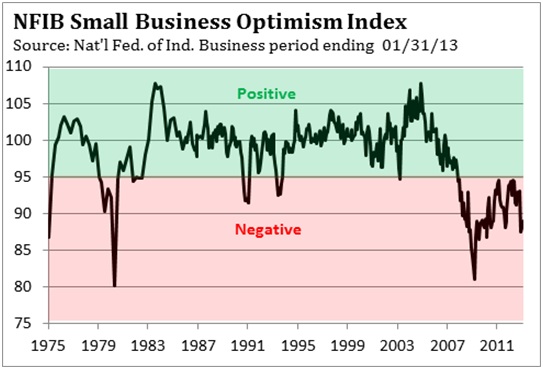 The best antidote for what ails the U.S. economy is jobs, jobs, jobs. Historically, small businesses have created more than 60% of new jobs, so creating a favorable environment for supporting small businesses and the confidence of small business owners should be a goal of government policies. The National Federation of Independent Business surveys small business owners each month assessing their hiring plans, economic outlook, and overall optimism, The January 2013 report noted that business expectations for business conditions six months from now were at their fourth lowest reading in nearly 40 years, and that was after Congress avoided the fiscal cliff. The NFIB’s Small Business Optimism Index remains at levels only found during periods of recession. From September 2008 until mid-2012, small businesses said sales were their “single most important problem.” Since mid-2012, taxes and government requirements have competed with concern about sales as the number one problem for small businesses. Many business owners report continued confusion about what their health care liabilities will be in 2014 when the Affordable Health Care Act goes into effect.
According to the Kaiser Family Foundation, family health insurance premiums have increased an average of $3,000 since the Affordable Health Care Act was passed. Kaiser also found that almost half of small firms only offer their employees high-deductible plans. The shift in costs from the employer to the employee hasn’t just been limited to small business. According to benefits consultant Towers Watson, 70% of large companies have shifted all or most of their employees to high-deductible plans. (ie General Electric, Wells Fargo, JP Morgan Chase, American Express)
In January, the Treasury Department provided Affordable Care Act guidelines regarding staffing levels that may affect fines when the ACA begins. The ACA exempts companies with fewer than 50 employees, and defines part-time workers as those working less than 30 hours per week. If an employer fails to offer affordable coverage forcing the employee to receive health care subsidies from the government under ACA, companies could face fines of up to $3,000. The Affordable Care Act will likely have some unintended labor market consequences. Companies with employees just above or below the 50 employee threshold could be making decisions that are unlikely to benefit the labor market. Small companies with less than 50 employees won’t hire additional employees once they near the 50 employee threshold. Companies with just over 50 employees will be incentivized to reduce hours for some workers to below 30 hours per week, which will lower those employees income. On February 8, the National Retail Federation asked President Obama to “delay health care reform mandates that will force employers to cut their payrolls or reduce hours for workers.” Needless to say, the uncertainty about the implementation of the Affordable Care Act for large and small employers is unlikely to prove a boon for job growth as 2014 nears.
Economists from the University of Chicago and Stanford have constructed the U.S. Economic Policy Uncertainty Index based on newspaper coverage of policy related economic uncertainty, the number of Federal tax code provisions set to expire in future years, and disagreement among economic forecasters. For additional details go to www.policyuncertainty.com . Since 1985, a surge in the Uncertainty Index has foreshadowed a decline in economic growth and employment. In 2006 and 2007, the Uncertainty Index hovered below 75, before soaring in 2008 and early 2009 as the financial crisis exploded. Although the recession ended in June 2009, the Uncertainty Index has remained more than double its 2006 and 2007 level. Scott R. Baker, a Stanford Ph.D. economist and researcher who helps calculate the Uncertainty Index says, “We’ve definitely seen a big increase in uncertainty about health care and financial regulatory regimes and energy and climate regulations. This certainly is harmful to a recovery.” Surveys taken by Duke University and CFO magazine of Chief Financial Officers in December illustrate how regulatory uncertainty has affected investment spending plans over the last year. In December 2011, the surveys found that these CFO’s planned to increase investment spending 7.8% in the next 12 months. In September 2012, they lowered their investment spending target to 3.7%, and in the December 2012 survey to just 2.6% for 2013.
Based on estimates by the Small Business Administration, the Competitive Enterprise Institute calculates the cost of complying with Federal agency written regulations. According to the Office of the Federal Register, the Federal Register, which covers the rules and regulations by federal agencies, was 77,249 pages in 2012, up from 69,676 pages in 2009. In a forthcoming report called Tip of the Costberg, the Competitive Enterprise Institute estimates the cost of compliance at $1.806 trillion. That’s right, trillion. This compliance burden is almost 12% of total GDP. The 2012 Federal budget was $3.6 trillion and 22.5% of GDP. The combination of government spending and regulatory compliance amounts to more than one-third of GDP. State and local spending represents almost 12% of GDP and another layer of regulation. Put it all together and all levels of government directly and indirectly control approximately 45% of the U.S. economy.
The economy grew just over 2% in 2012 and growth is unlikely to accelerate in the first half of 2013. Although job growth improved in the fourth quarter, wages and salaries advanced just 1.9% last year, so most workers aren’t keeping up with the cost of living. The 2% increase in the social security tax, higher cost for a tank of gas, and the rising burden of health care coverage are relentlessly squeezing incomes for most families. Businesses, large and small, are coping with an avalanche of regulations and unknown health care costs which are holding down hiring and business investment. We don’t think the economy is on the verge of a pronounced slowdown. The recent rally in the stock market has been quite strong, and the market rarely tops coincident with peak momentum. In 2007, the stock market reached a momentum peak in June, before making a new high in October on much weaker upside momentum. It was after this ‘rally failure’ that the economic news turned sour. As long as the S&P 500 holds above 1,400, any bad news about the economy is likely months away. Most economists are expecting growth to pick up in the second half of 2013 and that’s when things are likely to get interesting.
Eurozone
In the fourth quarter Eurozone GDP contracted at a 2.3% annual rate and was down -.5% for 2012, according to Eurostat. The fourth quarter weakness was broad based as almost every one of the 17 countries in the Eurozone experienced a decline. In the four largest economies, GDP fell 2% at an annual rate in Germany, 1.1% in France and 3.7% in Italy, while Spain contracted 2.8% with Portugal and Greece’s GDP falling more. According to the European Central Bank, lending to the private sector fell .7% in December from a year earlier. It is the eighth consecutive decline and a sign that the cheap liquidity provided by the ECB is not finding its way into the Eurozone economy. As we have noted many times over the last year, European bank lending represents 80% of credit creation in the Eurozone, versus 35% by U.S. banks in the United States. This underscores the importance of a functional banking system to foster economic growth in Europe. According to Markit, the Eurozone Purchasing Managers Index was 48.2 in January. As long as it remains below 50.0, manufacturing is still contracting. In January, new car registrations fell 8.7% from January 2012, falling to the lowest level since 1990 when records began. These figures, along with the contraction in lending, suggest the weakness in the Eurozone is likely to persist through the first half of 2013.
Since the end of 2007, only Germany’s GDP has recovered all the ground lost during the subsequent recession.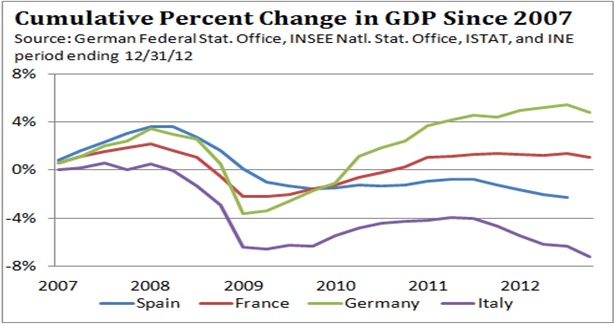 As a whole, the Eurozone remains 2.5% below where it ended in 2007. France’s GDP is .7% below its 2007 year-end level, while Italy is 7.2% lower and Spain’s economy is 5.8% smaller, according to J.P. Morgan Chase. Since 2009, one area of strength for the four largest economies has been exports. This growth was supported by a decline in the value of the Euro. From a high of $1.60 to the dollar in July 2008, the Euro dropped to $1.20 in July of 2012.
 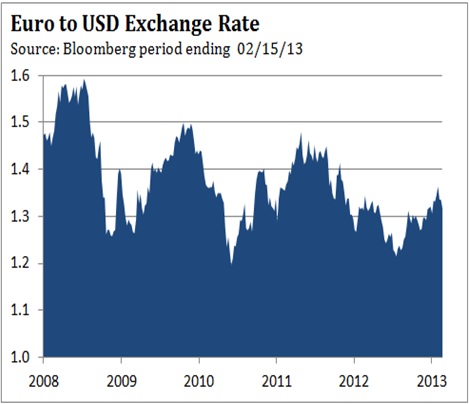 After Mario Draghi said the ECB would do whatever it takes to stabilize the Eurozone economy on July 24, 2012, the Euro has steadily strengthened. Since its peak in July 2008, the Euro has on average been 15% to 20% versus the dollar, which has boosted exports. According to J.P. Morgan and Co., German exports have grown from 41% of GDP in 2009 to 53% in 2012. Exports have increased from 22% of Spain’s GDP to 35% last year, while Italy’s has improved from 22% in 2009 to 30% of GDP in 2012. France hasn’t benefited as much since exports made up 27% of 2012 GDP, up from 22% in 2009. Since the low in July 2012, the Euro has risen 13.7%, and 7.5% since early November. Deutsch Bank estimates that the increase in the Euro won’t hurt Germany, since it exports luxury cars and high end engineering products. That isn’t the case for France or Italy. Deutsch Bank estimates that French companies begin to lose competitiveness if the Euro is above $1.24, while Italian firms feel squeezed above $1.17. Eurozone exports to Japan are likely to suffer more, since the Euro has soared more than 20% versus the Yen just since early November 2012. We do not know the weighting of Eurozone exports by country to the United States and Japan. We do know that a more expensive Euro is a headwind that will slow Europe’s recovery. Since changes in exchange rates take three to six months to impact export sales, the drag from weaker exports is likely to be felt around mid 2013, just when many economists expect the Eurozone economy to pick up.
China
According to the National Bureau of Statistics, GDP grew 7.9% in the fourth quarter, up from 7.4% in the third quarter. 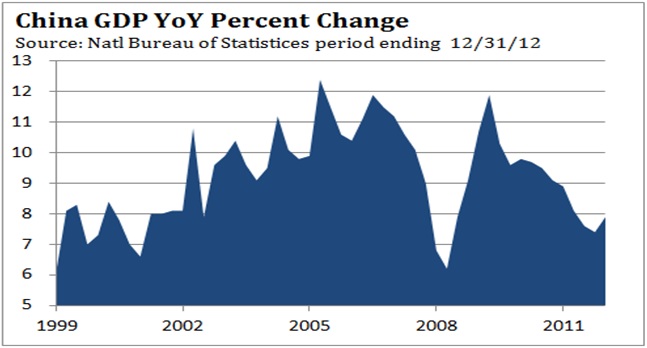 This confirms our assessment last year that China would avoid a hard landing, with growth stabilizing in the 6% to 8% range.
China celebrated its Lunar New Year in February this year. In 2012, the Lunar New Year fell in January. Since China virtually shuts down for an entire week for the celebration, comparisons of economic data in January and February versus last year will be distorted and unreliable. Data for January 2013 will look stronger when compared to January 2012, while February 2013 statistics will be weaker. Global investors were heartened when China’s PMI for manufacturing and services for January improved. Trade data for January showed exports jumped 25% from January 2012. However, when the figures were adjusted for the Lunar New Year, exports only grew 12.4% versus 19.2% in December. Although the effects of the Lunar New Year are known, investors will have to shrug off potentially disappointing data for February when stats are reported in March. When the dust settles, China’s growth should improve modestly in coming months, with GDP holding in a range of 8% to 9%.
Japan
It’s been more than 22 years since Japan’s real estate and stock market bubble deflated causing an implosion of Japan’s banking system. Since then Japan’s government has recycled numerous deficit spending programs to jump start its economy and the strangle hold of deflation. Since 1998, Japan’s debt to GDP ratio has soared from 100% to 230% of GDP. Even though Japan’s 10-year bond yield is less than 1%, interest expense on their debt consumed almost 25% of Japan’s budget last year, versus 7% of the U.S.’s 2012 budget. Japan has been able to pursue this path since more than 90% of its debt is owned by domestic institutions and households, so Japan is not dependent on the kindness of strangers. For most of the past 20 years, the Yen has been strong, lifting the purchasing power of Japanese savers and encouraging them to keep their savings in Japan.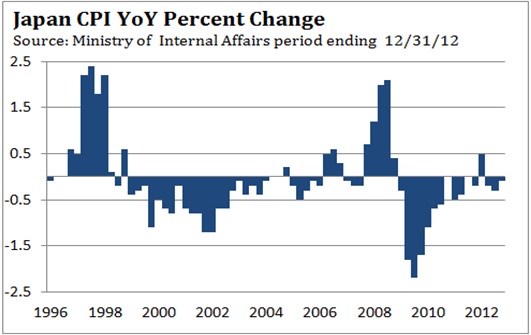
Other than a brief time in 2007 and the first half of 2008, consumer prices have been falling as deflation held sway. With prices falling, any positive return on savings, even .15%, represented a real positive return. In the U.S. inflation is 2%, so any interest rate that is less than 2% provides savers a negative real return. Despite large deficit spending and exceptionally low interest rates, GDP growth in Japan over the last 15 years has been spotty and on balance weak. GDP contracted for the last three quarters of 2012, shrinking .4% in the fourth quarter. Exports fell 3.7% and Japan suffered its largest annual trade deficit ever in 2012. In response to the contraction in GDP and trade deficit, Japan has embarked on a concentrated effort to weaken the Yen, with the hope of reviving growth through an increase in exports. Since early November, the Yen has fallen 7.5% against the Dollar and more than 20% versus the Euro. As a result, the purchasing power of Japanese savers compared to savers in the U.S and Europe has fallen commensurately.
In 2010, oil provided 42% of Japan’s total energy consumption, while coal made up 22%, natural gas 18%, and nuclear power 13%, according to the International Energy Agency. With the tsunami nuclear disaster in March 2011 and reduction in nuclear power generation, Japan has increased its use of oil by 10.3% and natural gas by 16.1% in 2012. According to the Energy Information Administration, Japan produces only 16% of its energy needs domestically, and relies on imports for the balance. Japan is the world’s largest importer of natural gas, second largest importer of coal, and third largest importer of oil. The decline in the Yen is increasing the cost of these imports and will result in more inflation and a larger trade deficit, at least in the short run. After 20 years of monetary and fiscal policy failures to rejuvenate the Japanese economy, the risks associated with Japan’s effort to depress the Yen’s value has the look of desperation.
In our September commentary we discussed the risk of protectionism that has emerged during previous periods of slowing global growth and expressed our concerns it might reappear in the current environment.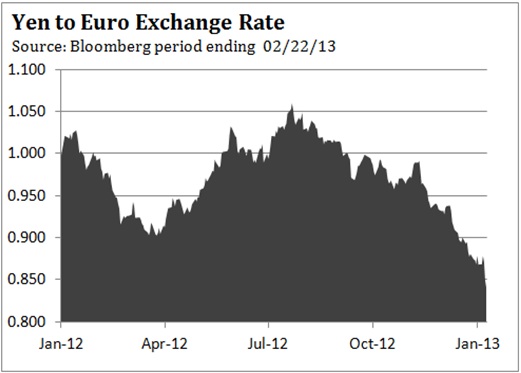 In the past, countries have used tariffs or other trade restrictions to protect domestic jobs. As the Depression began to take hold in 1930, the United States passed the Smoot-Hawley Tariff Act in June 1930 to protect American jobs. This incensed other countries who responded with their own trade protections, resulting in a 40% decline in world trade in the following 18 months and an intensification of the depression. Japan’s overt program to lower the value of the Yen in order to boost exports is a modern day form of protectionism. As discussed earlier, the impact on exporters in Europe and the U.S. will be negative as they compete with Japanese producers for sales around the world in coming months. Should the Yen continue to depreciate against the Dollar and Euro as we expect over the next year, trade tensions could mount, potentially resulting in retaliation from Japan’s trading partners.
Stock Market
Last month we noted that the percent of bulls in the weekly Investors Intelligence survey had exceeded the percent of bears as of January 25 by 30.9%. In the following two weeks, the plurality expanded to 32.0% and 33.6% in the February 8 survey. Over the last three years the market has been near at least a short term high when there was this much bullishness. We also pointed out that for most of the past three years the S&P has been trading in a rising channel, and was testing the upper boundary just above 1,500. 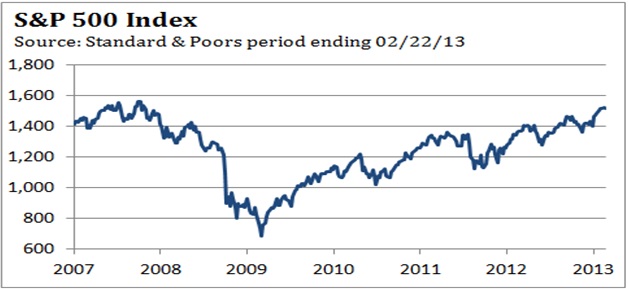 With momentum quite strong, we thought the S&P may be able to push a bit higher (1%-2%) and hold up for awhile (it did). However, we did not think the current risk reward relationship favored conservative investors. The S&P reached 1,531 on February 20, and the long awaited correction has likely begun. According to data compiled by Bloomberg through February 19, average daily price moves for the Standard & Poor’s 500 Index had fallen to 0.43 percent in 2013, from an average 1.08 percent the past five years, the steepest decline for any corresponding period since the 1930s. Our guess is that volatility will pick up as trading becomes choppy, with the S&P 500 potentially dipping to 1,465-1,485 before the correction/consolidation period is over. The odds favor the S&P pushing above 1,531 in coming months. The S&P 500 has made higher highs and higher lows since its March 2009 bottom, and as long as the S&P 500 holds above 1,370, the long term trend is up.
Gold
Last month we discussed the potential that gold had been consolidating its significant rally from $700 in 2008 to its peak at $1,920 in September 2011. 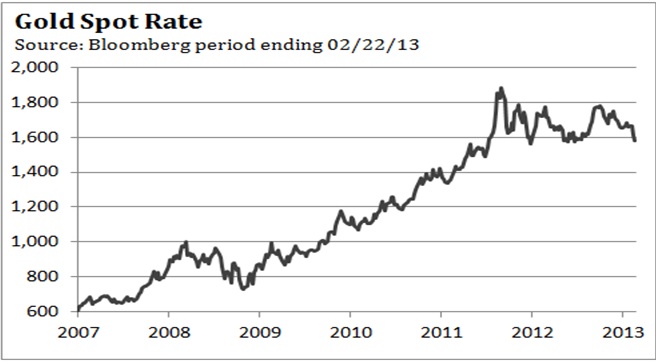 Technically, since that high, gold has been tracing out a triangle. We thought gold might dip one more time to $1,525-$1,550 to complete the triangle. On February 21, the April contract in gold dropped to $1,554.30. Our guess is that gold is likely to drop below this level, after an oversold bounce and do more ‘work’ before an important low is completed. Gold must hold above $1,480- $1,500 on a closing basis to keep the triangle pattern intact, and the subsequent potential for a rally to $2,300 over the next year. A decline below this support area would be a long term negative.
Source:
Jim Welsh
Forward Markets: Macro Strategy Review, February 2013

