Source: WSJ
I wanted to take a moment out this morning to briefly discuss the differences between real, nominal, after tax, and total returns:
Why is it that nearly any chart that gets posted — be it index, stock, bond or commodity — invariably results in a knee jerk demand for an inflation adjusted version? I half expect to see those comments on even intra-day stock charts.*
Different return measures (and the corresponding charts that go with them) provide information about different things. It is not, as some suggest, that one is inherently superior to another. Rather, they measure different things, provide a different context, and are appropriate in different circumstances.
Perhaps a few definitions are in order:
Nominal Returns: Are what an investment generates before taxes, fees and inflation. It is simply the net change in price over time.
Real Returns: Are the actual value of your returns, typically after adjusting for inflation and fees. During a period of high inflation (i.e., 2001-07), Real Returns inform the gains minus inflation by keeping purchasing power of capital constant over time.
Net Returns: Usually referenced in the context of high fee investment vehicles like VCs or Hedge Funds. Net returns informs the investor exactly what they have left after managers take their pound of flesh. Can reference net of fees and/or taxes and other expenses. (Related definition: Net Return Shock!)
Total Returns: Is the combination of both capital appreciation (change in market price) plus all interest, income, dividends and distributions.
After-Tax Returns: Usually used in reference to tax-advantaged securities (i.e., municipal bonds, TIPS), it is the actual financial benefit which accrues to an investor on an after tax basis. The after-tax return often differs significantly from the nominal rate of return. It is dependent upon the investor’s city and state of resident, Federal tax bracket.
All of these return measures are valid ways of depicting slightly different measures of investing results. They seek to gauge returns in slightly different forms relative to each other. They actually measure different things, and each are more (and often less) appropriate in specific settings.
While the numbers used to depict these varied forms of returns are neutral and objective measures, how they are employed often is not. I see an awful lot of biases revealed in some quarters always selecting one type of return or another. Always showing inflation adjusted returns is an attempt to reduce the returns of a rally, typically one missed by the speaker. Never showing inflation adjusted or Total returns reveals a similar if opposite bias.
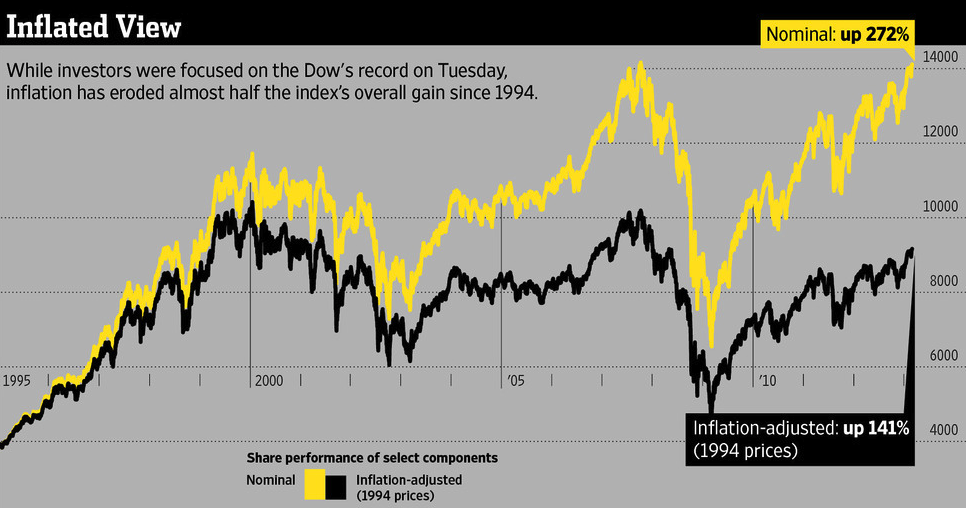
Which brings us to the chart shown up top. If you want to get a true picture of returns, inflation adjusting alone is misleading. Consider the typical investor saving for retirement in an IRA or 401k. For these investors, the real inflation adjusted return is important, but so is their total return. Their real total return informs them both of the dollar amount of their investments’ worth plus any change in its purchasing power.
This leads investors to the most important questions about their long-term investing in the first place. It is a fair question to ask: How much money will you have when you retire, and what will that sum of money be worth?
___________
* Yet another reason to look askance at comments.


What's been said:
Discussions found on the web: