
Beyond the Dow, S&P500, and Japanese stocks the major global equity indices have been carving out some fairly ugly charts.
It’s becoming increasingly difficult to extract market signals as the massive of flood of Bank of Japan money printing begins to flow into the global tributary, which also includes the Fed’s quantitative easing. Markets, in our opinion, are going to become incredibly gummed up and exhibit unprecedented and unpredictable behavior throughout the rest of the year.
Who would of thought the dollar/yen pair could rally 50 percent from April 1995 to April 1997?
The yen carry trade fueled massive flows into the emerging markets, pumped up the U.S. dotcom bubble, and distorted Asian exchange rates, which, some say, contributed to the 1997 Asian financial crisis and 1998 Russian debt default.
Buckle up. The next year is going to make Mr. Toad’s Wild Ride look like a Merry-Go-Round!
By the way, if your weren’t watching on Friday sovereign bond yields came in big time. France, for example, tightened 20 bps to the German bund last week.
Is the recent collapse in global sovereign yields, including the 10-year Treasury to a 2013 low, signalling global recession and increased risk aversion or central bank quantitative easing gumming up markets and rendering price signals useless? It’s tough to make the case that the recent soft patch in the data and one bad employment number can move yields down as much as they have.
No wonder corporates are confused and hesitant to expand capacity when they see depression level interest rates and record high stock prices. WTF?
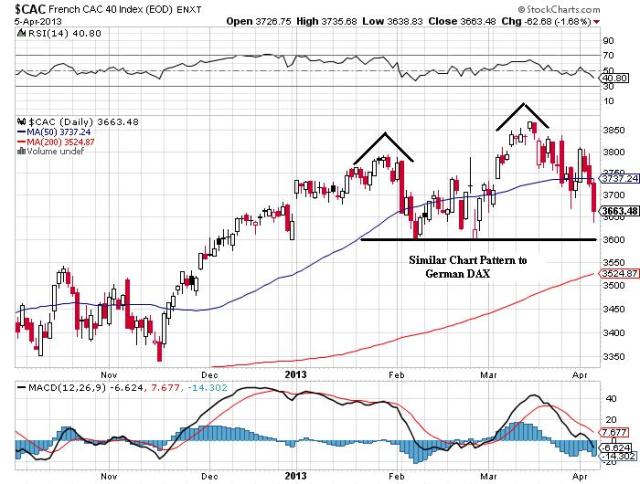
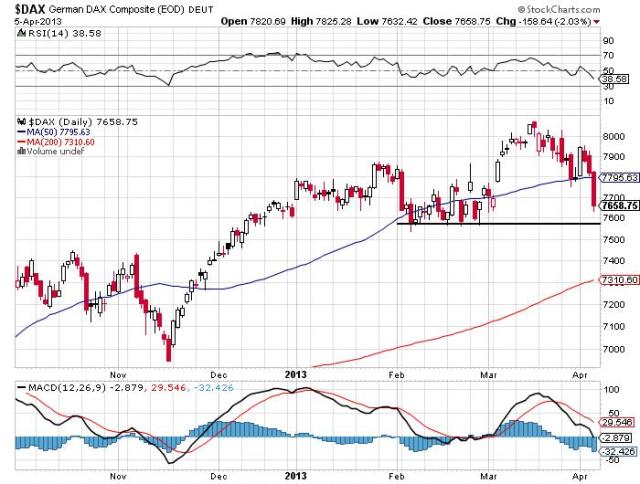
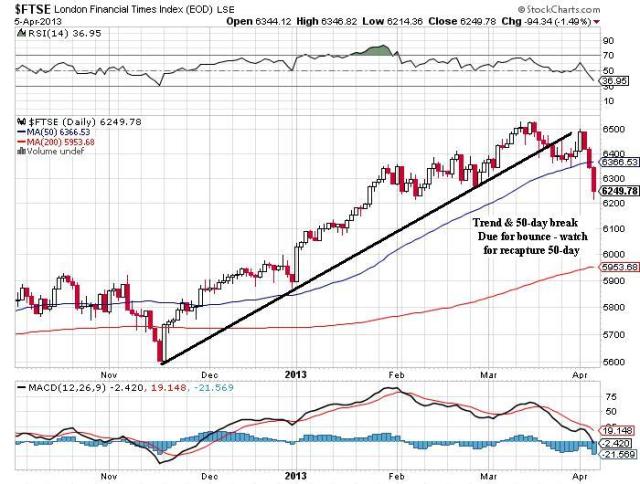
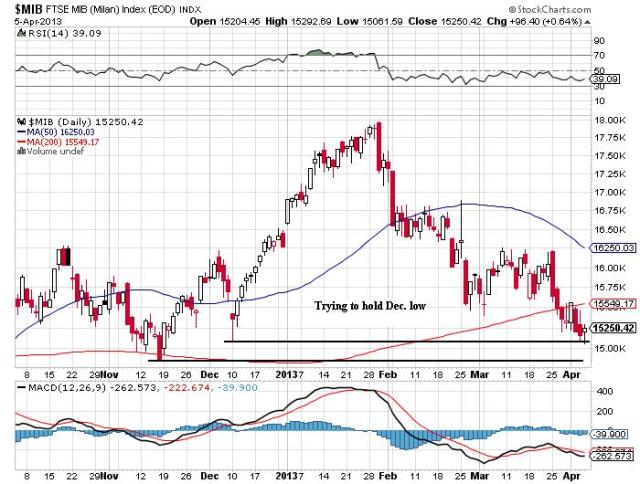
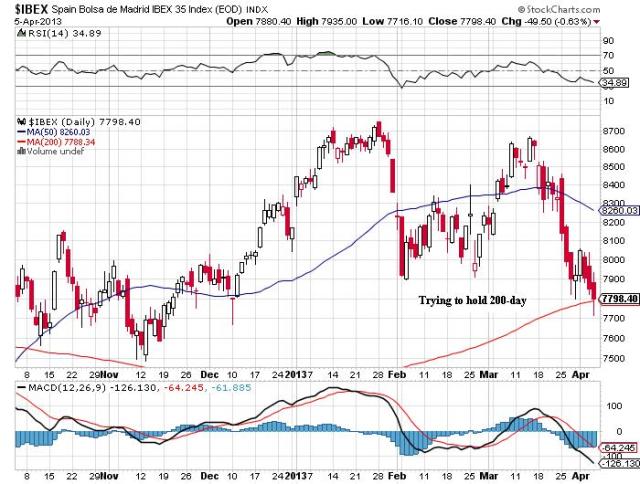
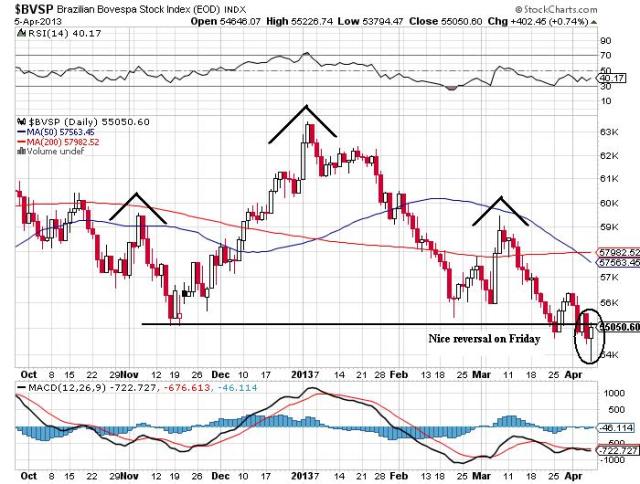
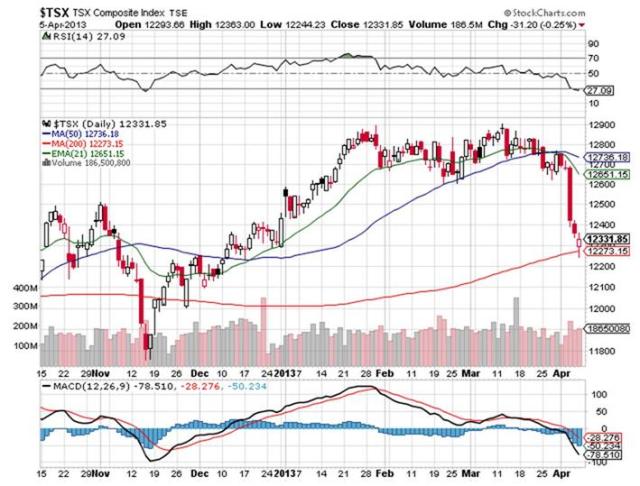
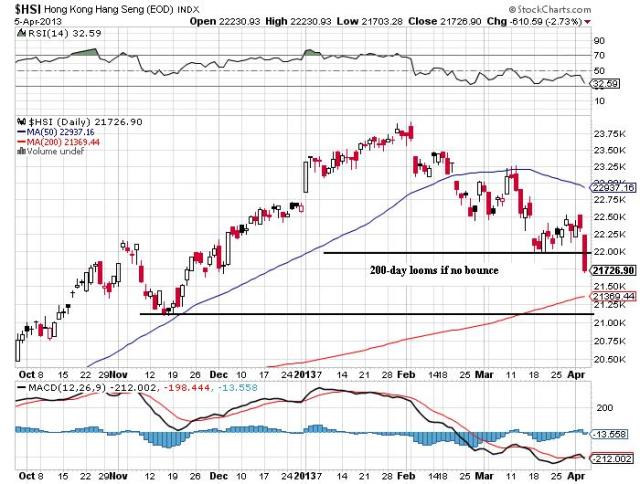
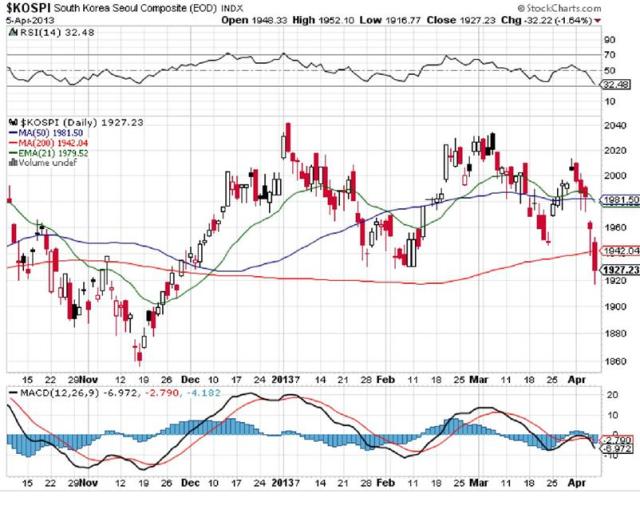
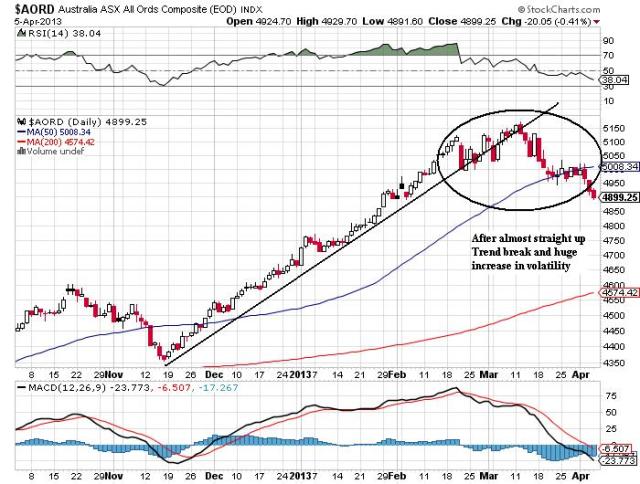
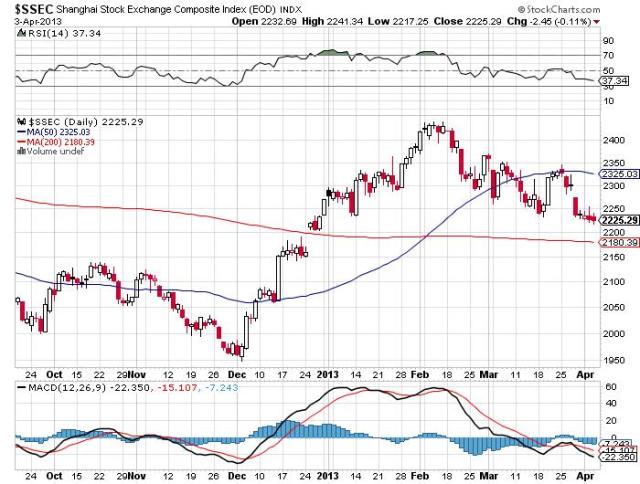
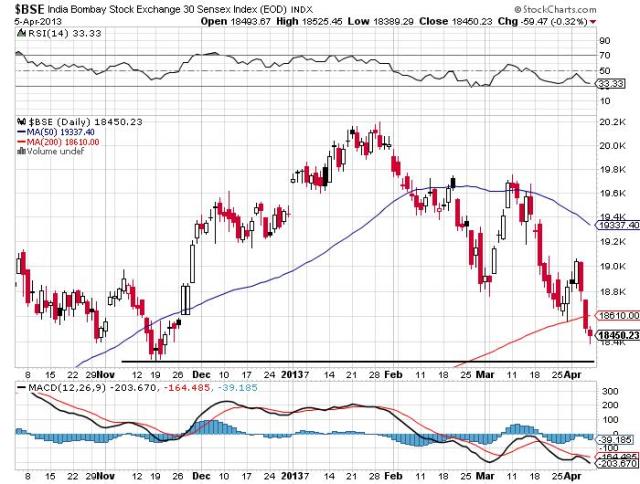
Nevertheless, we’ve assembled a mosaic of some of the ugliest charts in the world.
Where markets go from here is anybody’s guess. The traditional flight (market) indicators and global compass have been distorted by the global central banks. The wave of liquidity will only get larger before it crests when the Fed changes policy.
The key, then, is to pick the spots where to surf the liquidity. Dollar/yen, Japanese equities, and U.S. large cap stocks with mature cash flows seem to be the bonzai pipeline of financial trading for now.
We’re in uncharted waters, folks. We have our biases to how this all ends – mostly negative — but if anyone thinks they definitively know, avoid them and head for the hills.
Let’s go to the charts.

~~~

~~~
~~~
~~~
~~~
~~~
~~~
~~~
~~~
~~~
~~~
~~~
~~~
(click here if charts are not observable)

What's been said:
Discussions found on the web: