
The Relative Strength Index (RSI) is a momentum oscillator that measures the speed and change of price moves. The RSI moves between zero and 100 and is considered overbought with a reading above 70 and oversold when below 30. Note the RSI can sustain an overbought (oversold) reading in a strong up (down) trend.
Click chart to enlarge.
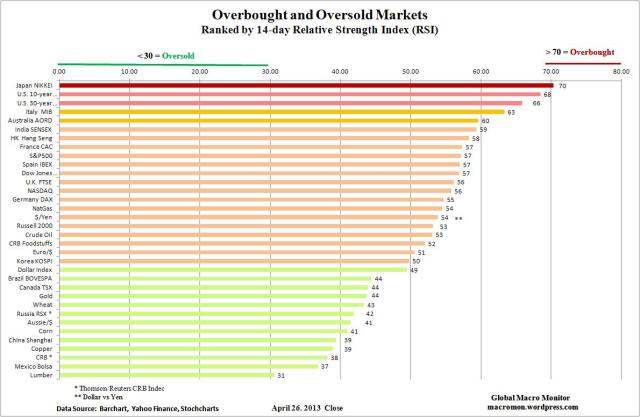
(click here if chart is not observable)
~~~
Global Trend Indicators

~~~
 (click here if charts are not observable)
Week in Review

~~~

~~~

~~~

~~~

(click here if chart is not observable)

What's been said:
Discussions found on the web: