
click for ginormous chart
Source: Kimble Charting
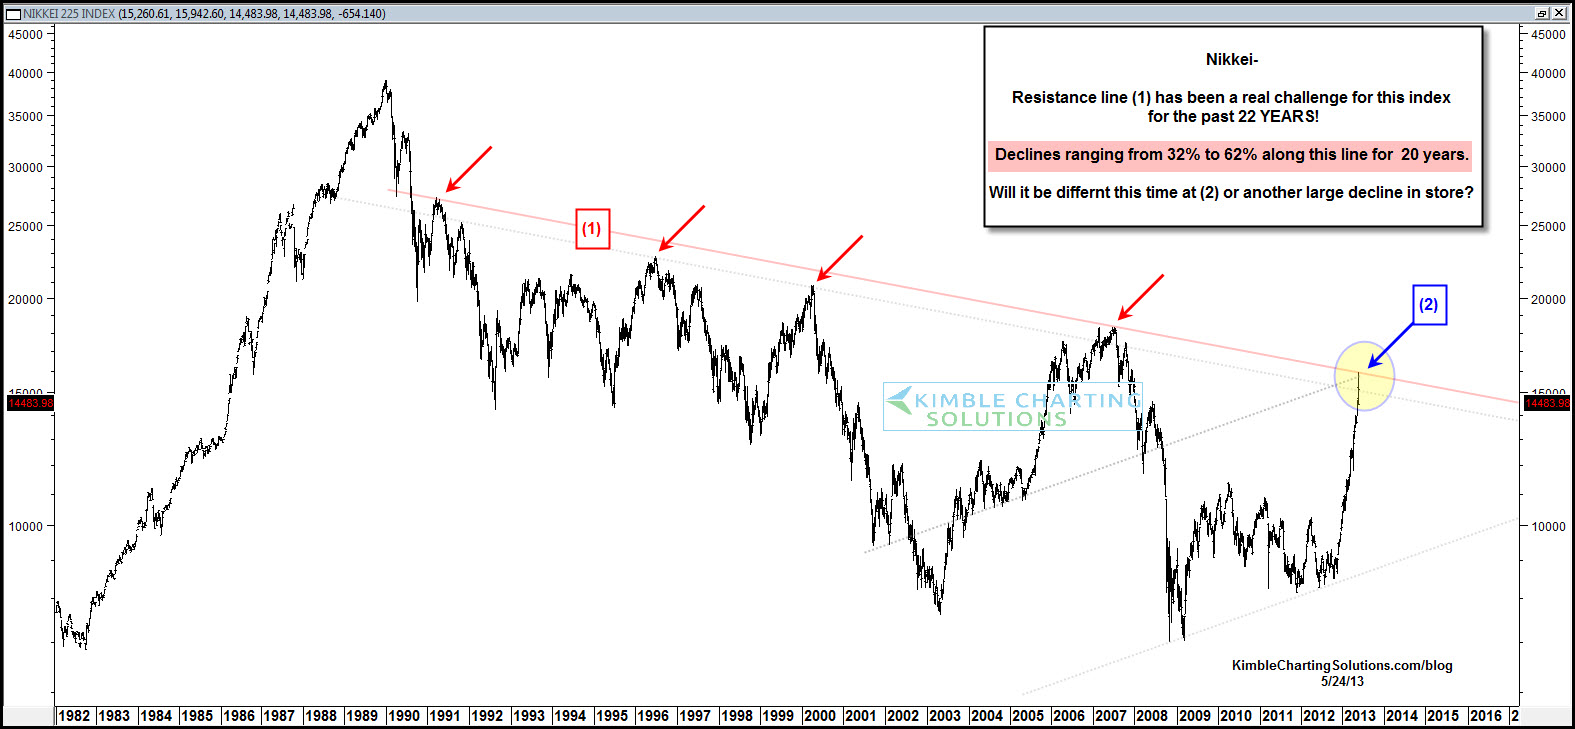
Awesome chart from Chris Kimble showing the Nikkei going back to 1982 — in particular, the downtrend that began in 1989 and still persists to this day.
Chris notes that Declines of 32% to 60% taken place at this level for the past 20 years!
One would normally expect a pullback and consolidation after a long move up to a major trendline, and under pre-Abenomics stimulus, that would be my highest probability outcome (pre-stimulus, I have no idea!).
The key here is if and when the Nikkei breaks through that trendline, it is likely the beginning of a longer term multi-year breakout. This is why we put on Japan exposure for clients much earlier this year.
~~~
Disclosure: Clients are long GAL, DXJ, which have substantial exposure to Japan.

What's been said:
Discussions found on the web: