
Click to enlarge
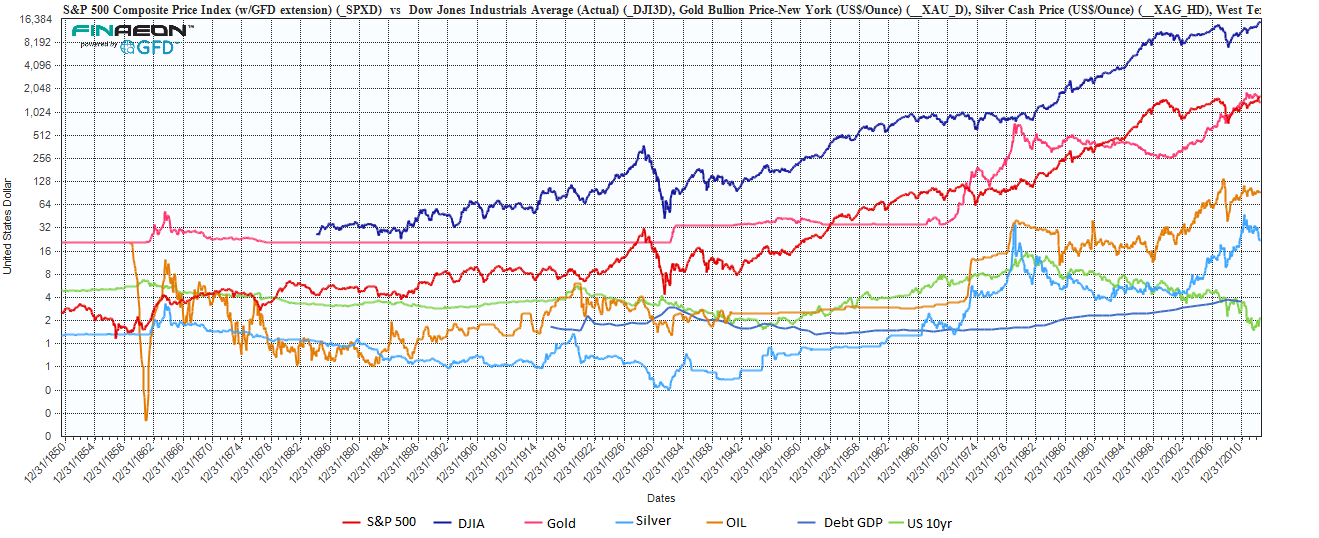
I do not ever recall seeing all these in one place in one chart: S&P 500, DJIA, Gold, Silver, West Texas Intermediate, Total Debt as a % of GDP and the US 10yr to 1850.
Many of these are at or close to all time highs. (Note the exception is the US 10yr Yield, which trade at an inverse to the bond).
We rarely look at them all together. In doing so, it’s amazing that for as much problems that we appear to have politically, economically and socially, the markets appear unfazed in any way. Resilient.
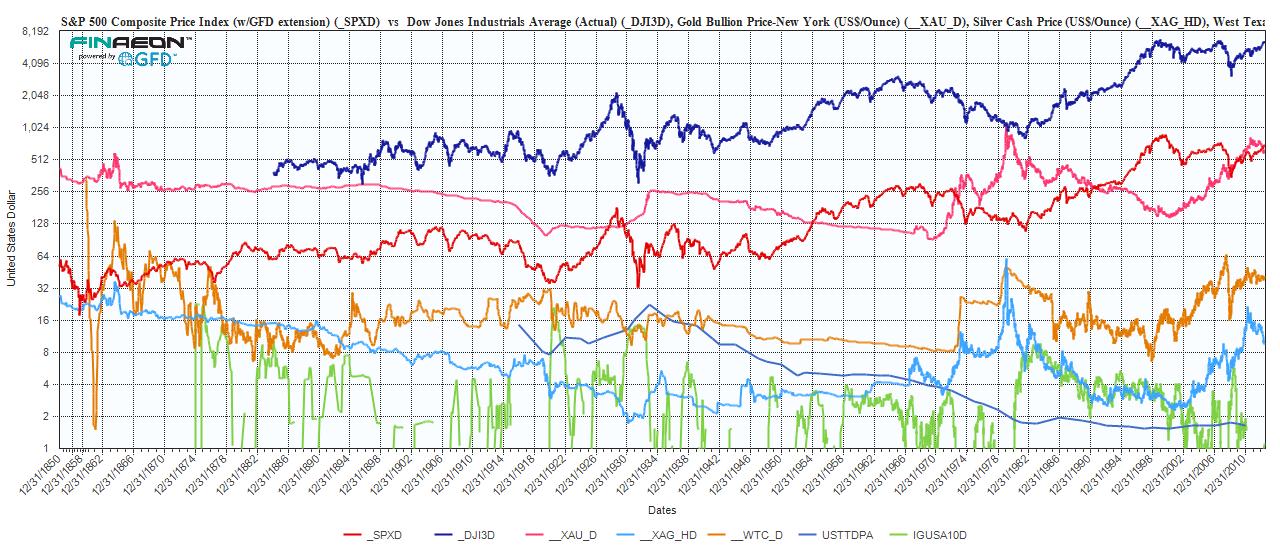
UPDATE: June 13 2013, 3:49pm
Adjusted for Inflation you say? Done:
Click to enlarge
Source:
Ralph M Dillon
Global Financial Data, June 12, 2013
www.globalfinancialdata.com

What's been said:
Discussions found on the web: