
The US 10 yr Constant Maturity Yield
Click to enlarge
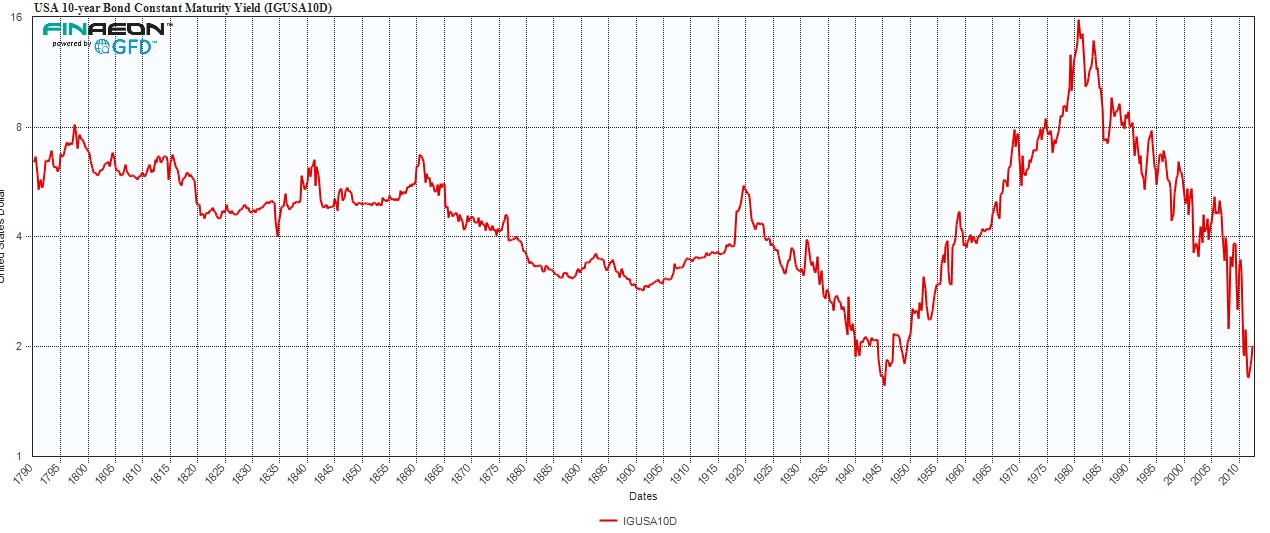
Souce: Global Financial Data
The move in the 10 year yields has led to all sorts of speculation as to the underlying cause.
Since none of this is within our my control, all we can do is look at this from a longer term perspectives to put this into broader context .
Three takeaways:
1) Bond Yields can be driven to extreme son the upside and on the downside.
2) It takes many years or decades to unwind a move like that
3) Rates could go appreciably higher if the 30 year bond bull market is over.
Looking at yields from an historical perspective, there is still plenty of room for yields to rise if they simply “normalize.”
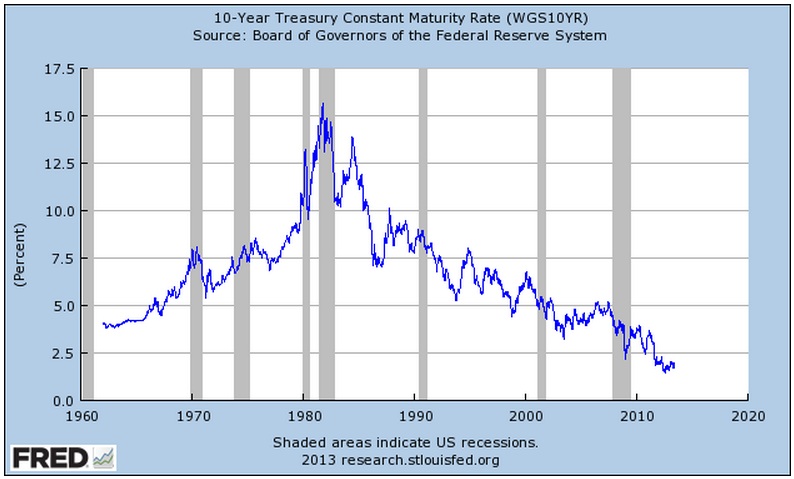
The chart below put the past 5 decades into sharp focus:
1980-2013 10 Year Yield Constant Maturity

What's been said:
Discussions found on the web: