
Click to enlarge
From Merrill Lynch’s technical team:
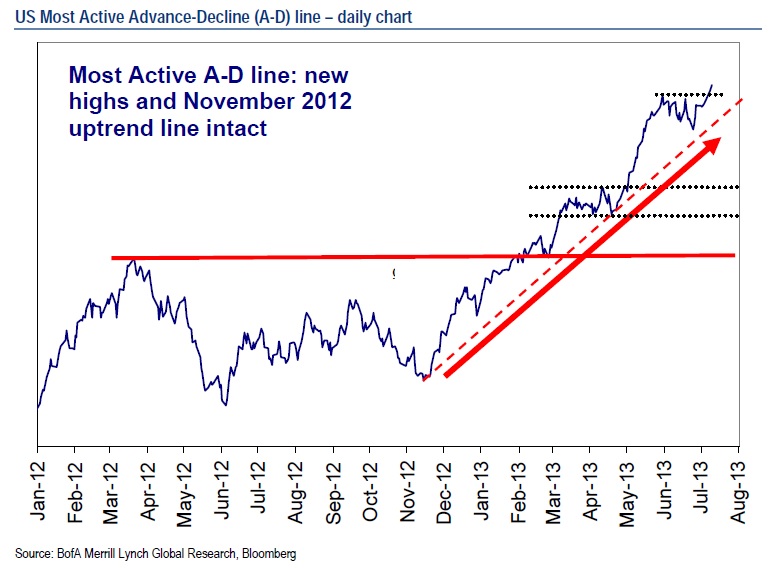
The Most Active A-D line breaks to new highs
The Most Active Advance-Decline (A-D) line is a market breadth indicator of the daily top 15 most active stocks by share volume in the US. These stocks are generally more liquid with larger market caps where the trading is dominated by institutional investors. The Most Active A-D line has moved to new highs, which is bullish for the US equity market. This is similar to the breakout for the Most Active A-D line in late April (Chart Talk, 30 April 2013) and confirms the strength in the stocks only A-D lines (Chart Talk, 10 July 2013).In addition, unlike the S&P 500, the Most Active A-D line did not break the uptrend line from last November. Strong market breadth supports the case for a continued US equity market rally. See Market Analysis Comment, 09 July 2013 and Chart Talk, 10 July 2013 for more details and key technical levels for the S&P 500.
Source:
Most Active A-D line: new highs & uptrend line from Nov intact
Stephen Suttmeier and Jue Xiong
Bank of America Merrill Lynch, July 11, 2013

What's been said:
Discussions found on the web: