
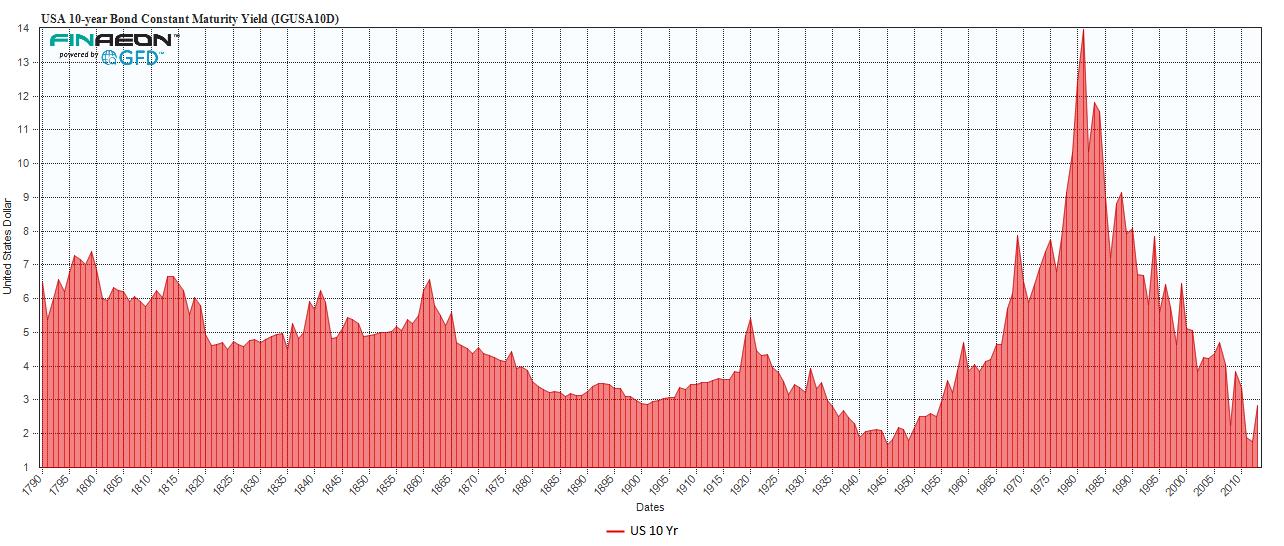
Here is a historical look at the US 10 Yr and CPI with Annual Percentage Change:
Click to enlarge
~~~

~~~

Under normal circumstances, interest rates will rise along with inflation. They more or less move in lock step. But ZIRP and QE means that these are not normal times. Thus, the FED’s intervention means that correlation has been at least temporarily broken.
This raises the question: Given the magnitude of the move in percentage terms, we must ask if the spike in yield signal “Tapering” or is it revealing the start of inflationary pressures?
As the end of QE approaches, we should see yields normalize. That suggests that Yield has plenty more upside room to grow.
Note: We are underweight bonds
Previously:
Proof the Bond Bull is Over: PIMCO Selling Hedge Funds (August 29th, 2013)
Source:
Ralph Dillon
www.globalfinancialdata.com

What's been said:
Discussions found on the web: