
click for ginormous chart

Source: Investech
We are almost through September and despite its reputation for volatility, the month has seen strong upside and new bull market highs.
The S&P500 lost “only” 4.6% in August, but based on the Sturm und Drang you are forgiven for assuming it was 3X that amount.
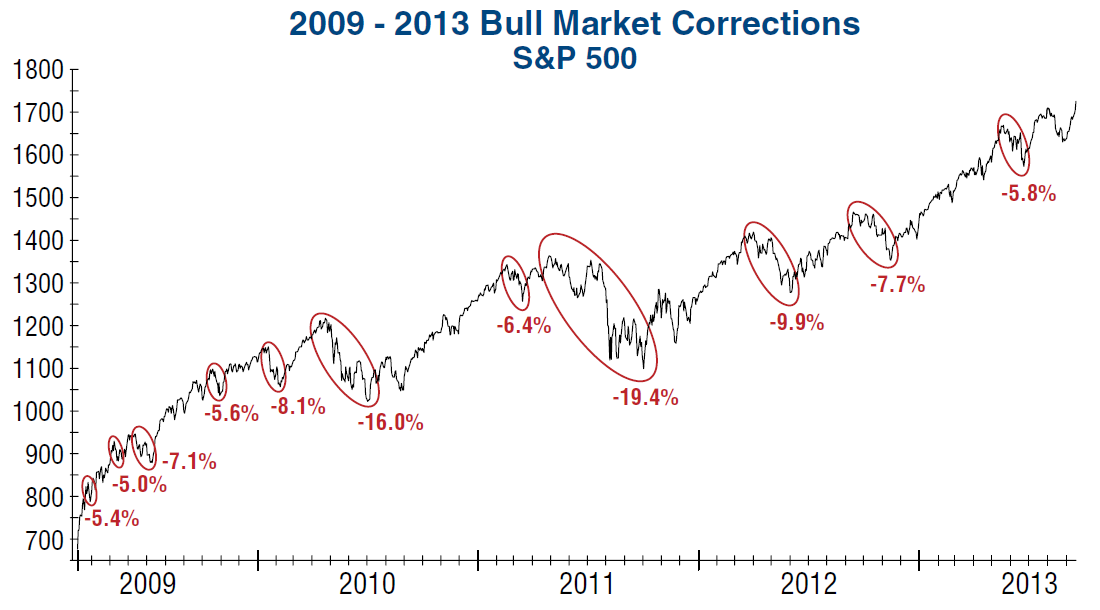
As the chart above shows, there have been lots of 5%+ retrenchments since the market lows of 2009. Its worth noting that the corrections since 2011 have gotten shallower.
Here is Jim Stack:
“Historically, the average time between market corrections is 7.6 months. However, as shown in the graph [above], there were five corrections in just the first year of this bull market. After the initial 12 months, corrections slowed and followed a more typical pattern, occurring once or twice a year. Altogether, there have been 11 corrections of 5% or more, with two of those logging greater than 10% declines.
How does this compare to other extended bull markets? At 4.5 years, this bull market is already one of the longest since the Great Depression. Looking at the S&P 500 back to 1932, the average bull market duration is 3.8 years and, in comparison, this one is getting a little long in the tooth. Still, it does have a few peers… of the 16 bull markets over the past eight decades, only five prior to this one lasted more than 4.5 years.”
Good stuff. Stack is one of my favorite off Wall Street strategists, and I always appreciate his cool, data driven analyses.

What's been said:
Discussions found on the web: