
Shiller P/E Bottoms Coincide with Major Lows, Downtrend Breaks Precede Rallies
Click for ginormous chart
Source: Merrill Lynch
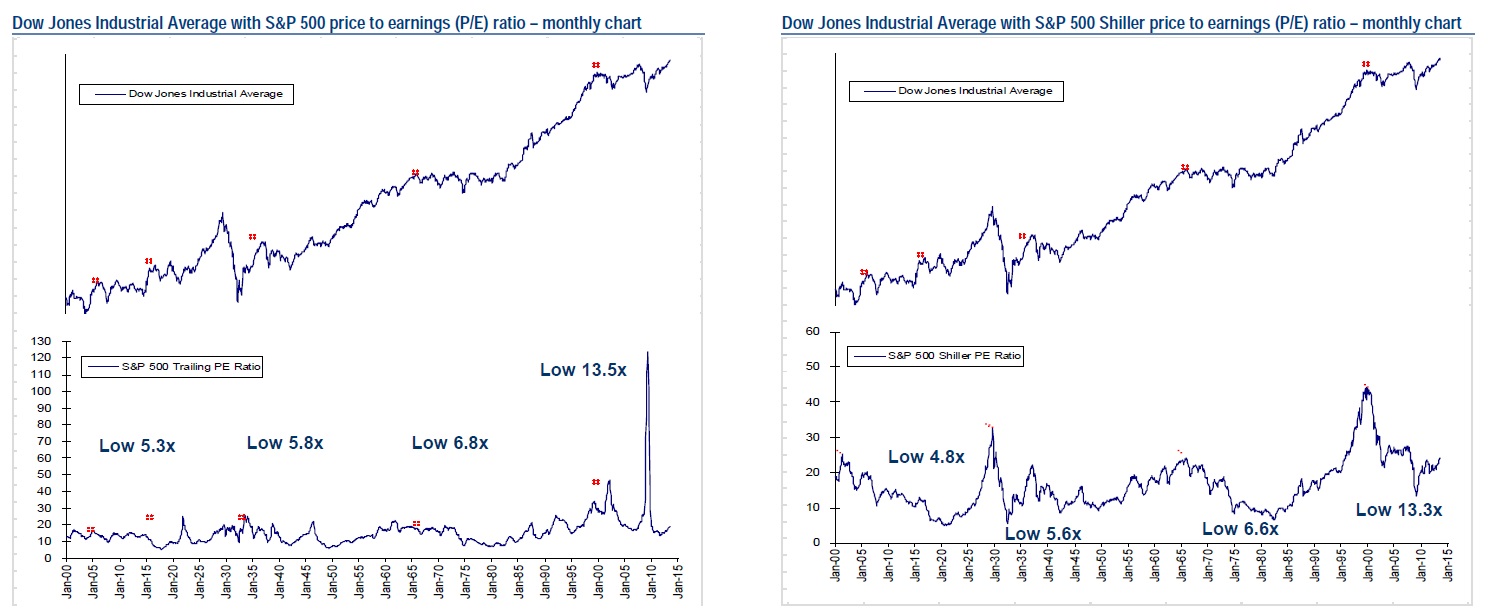
Nice chart from Stephen Suttmeier & Co looking at how the Shiller P/E ratio compares to regular P/E at major lows, downtrend breaks, and before rallies:
The good news is that secular trading ranges lead to better valuations that limit late stage secular trading range pullbacks. So don’t panic – we don’t expect anything like the 2000 or 2008/2009 period. Note that during periods of market consolidation valuation levels as measured by price/earnings multiple reaches extreme cheapness – 5.3x December 1917, 5.8x June 1949, 6.8x April 1980 and so far 13.5x in September 2011. An important point is that the market bottoms before the price-earnings multiple does.
The Shiller Price to earnings ratio is based on average inflation-adjusted earnings from the previous ten years. Major bottoms for the P/E ratio coincided with major lows in 1920, 1932, 1982, and 2009. Breaks above the longer-term downtrend line in the Shiller P/E have preceded market rallies and higher valuations. These downtrend line breaks occurred in 1922, 1945, 1951, 1983, and 2011
Good stuff . . .
Source:
Stephen Suttmeier, MacNeil Curry, Jue Xiong
BOA Merrill Lynch, September 10, 2013

What's been said:
Discussions found on the web: