
December 20
Our family at Forward hopes you and your family have a holiday season filled with happiness and joy.
Forward Markets: Macro Strategy Review
Macro Factors and Their Impact on Monetary Policy, The Economy and Financial Markets
Federal Reserve
“If at first you don’t succeed, try, try again. Don’t give up too easily; persistence pays off in the end.” This proverb was first published in 1840 in a book written by American educator Thomas Palmer, titled “Teacher’s Manual.” The original intent of the saying was to encourage students to not give up if they struggled to learn the three R’s – reading, writing and arithmetic. Over time, the concept of trying again and again has been broadened to almost every endeavor. Thomas Edison was famous for his many inventions that helped transform the standard of living for all the generations of Americans who followed. He certainly had a different perspective on failure: “I have not failed. I’ve just found 10,000 ways that won’t work.” But Edison was a true believer in persistence: “Genius is 1 percent inspiration and 99 percent perspiration.” Stars are frequently born in our culture with the help of the media, but our admiration is greater for those who become a success after 10, 15 or 20 years of hard work.
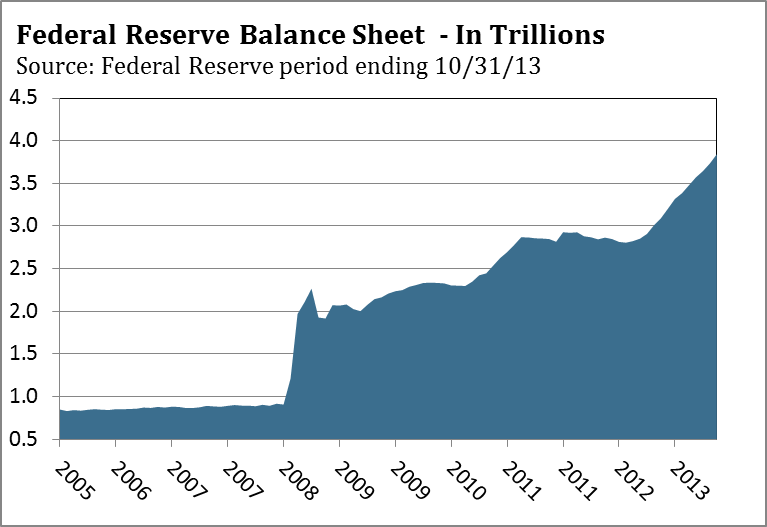
 No one can say the Federal Reserve hasn’t persevered since 2008 in its efforts to establish a self-sustaining recovery. The Fed’s most powerful monetary tool, the federal funds rate, has been held barely above 0% since 2008. If adjusted for inflation, the real funds rate has been well below 0%. When it became apparent a 0% federal funds rate was insufficient to calm the financial crisis, the Federal Reserve launched the largest monetary experiment in history. Since November 2008, the Fed has expanded its balance sheet from $900 billion to almost $4 trillion through its quantitative easing (QE) programs. The first round of QE began on November 25, 2008, and ended on March 31, 2010. In response to a slowing economy, quantitative easing was resumed on November 3, 2010, with QE2 ending on June 30, 2011. The third round of QE commenced on September 13, 2012, and continues today with $85 billion of monthly purchases of mortgage-backed securities and Treasury bonds. The Federal Reserve’s extraordinary monetary accommodation has been emulated through various measures by the Bank of England, European Central Bank and Bank of Japan.
 The immediate goal of monetary policy was to stabilize the financial system in 2008-2009 and restore a measure of confidence in it. In recent years, the goal of monetary accommodation has been to increase economic growth to a self-sustaining level so central banks can wean their economies and financial markets from the extraordinary monetary accommodation of the past five years. The path to solid economic growth has been littered with potholes and speed bumps. Europe’s sovereign debt crisis created a significant drag in growth in 2010 and 2011 since it pushed Europe into a secondary recession, which contributed to weaker global gross domestic product (GDP) growth. Since the summer of 2011, a dysfunctional Congress and overall lack of leadership in the U.S. has undermined businesses’ confidence and their willingness to invest and expand payrolls. The tsunami in Japan in March 2011, and the resulting nuclear power plant disaster, only intensified the deflation pressure that has weighed on global growth since 1989. GDP growth in developing countries slowed from 7.5% in 2010 to 4.5% in 2013, according to the World Bank, as sluggish growth in the U.S. and Europe’s relapse into recession throttled growth in many of those developing countries.

 Throughout the world, large budget deficits were used to offset the decline in aggregate demand when millions of workers lost their jobs. Although fiscal policy helped prevent an even deeper economic contraction from taking hold, the amount of government debt has increased significantly since 2007. Global sovereign debt was $30.1 trillion in 2007, soared to $52.0 trillion in 2013, and, according to the Economist Intelligence Unit, will reach $54.6 trillion in 2014. Debt in the U.S. has increased from $9.2 trillion to more than $17 trillion over the same period. Based on data from the International Monetary Fund (IMF), world GDP growth in 2007 was 5.2%. The IMF and Organisation for Economic Co-operation and Development (OECD) estimate that world GDP will increase to 3.6% in 2014, up from 2.9% in 2013. The increase in total debt and slowing of global GDP growth is troubling, however. In 2014, total sovereign debt will have increased by more than 80% from 2007, and the amount of global growth supporting this mountain of debt is likely to be 30% slower in 2014 than in 2007. With GDP growth reduced by 30% as compared to 2007, the amount of cash flow to service $54.6 trillion in debt will be stretched, even with interest rates near all-time lows in all of the developed countries.
What this analysis underscores is that the elephant in the room is global deflation. When the financial crisis erupted in 2008, policymakers had the capacity to lower interest rates and use large budget deficits to combat the economic contraction that followed. Although these actions were successful in preventing a deflationary collapse in 2009, policymakers are now left with relatively weak global growth, far more debt and only hard choices on how monetary policy can be normalized without risking a slowing of growth. Any increase in interest rates will claim a larger share of cash flow for debt service, leaving less for consumption of goods and services, and increase interest expense in government budgets. Any reduction in aggregate demand, as a result of higher interest rates and debt service payments, will slow GDP growth and result in less tax revenue. The narrowing of the budget deficit in the U.S. in recent years could stall, or worsen, should interest rates rise meaningfully. The Congressional Budget Office estimates a 1.0% interest rate increase would cost the Treasury $100 billion a year on the $17 trillion in outstanding debt.
 The risk posed by higher interest rates is likely keeping central bankers awake at night, especially members of the Fed’s Federal Open Market Committee (FOMC). Since early May, the 10-year Treasury bond yield has risen from 1.61% to 2.70%, even though the Federal Reserve is still buying $85 billion of debt every month. In the November 16 issue of Barron’s, the chief strategist at a major firm said, “The stock market is finally coming around to the Fed’s point of view that tapering is not tightening.”1 It’s hard to believe anyone would accept this comment at face value. The Fed saying “tapering is not tightening” is part of its sales pitch and marketing effort to limit the damage when it actually lowers its QE purchases. Imagine trying to sell the distinction between tapering and tightening to a prospective homebuyer last summer as mortgage rates jumped 1.0%. If bond yields rise in response to tapering, the bond market has tightened, even if the Fed maintains the federal funds rate at zero until 2017. In coming months, members of the Fed will stress that “forward guidance” (i.e., keeping the federal funds rates near 0% until 2016 or 2017) is more important than quantitative easing. The Fed’s hope is that forward guidance will anchor long-term rates and keep them from rising too much. The Fed also expects additional forward guidance will give the economy a boost if businesses and consumers know rates will not be increased for years. After five years of low rates, it is hard to see how knowing rates will remain low in 2016 will materially change investment and spending decisions in 2014. In our opinion, the only factor that really matters is demand, and that is most influenced by strong job and income growth, which have been MIA since the recovery began in June 2009.
In the movie Apollo 13, the astronauts had one chance to get their re-entry into the Earth’s atmosphere right. If the shuttle came in too shallow, they risked bouncing off the atmosphere and being lost in space. Coming in at too severe an angle would have caused them to enter the atmosphere too fast and heightened their risk of burning up. The Federal Reserve faces much the same dilemma. The Fed has spent five years nursing the economy back to health and a premature exit from QE3 could undo five years of effort. This is why the Fed is willing to accept the risk of more inflation down the road for maintaining QE3 until their confidence is higher. Based on the Federal Reserve’s dual mandate of stable prices and maximum employment, the Fed has the cover under each mandate to continue QE3.
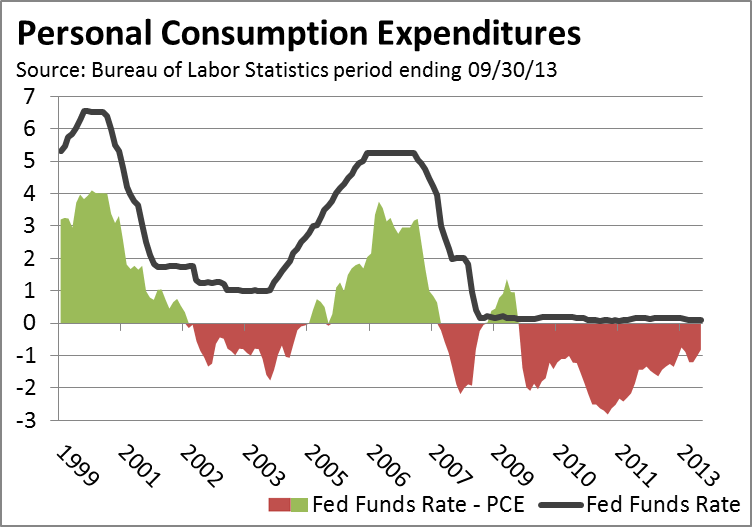
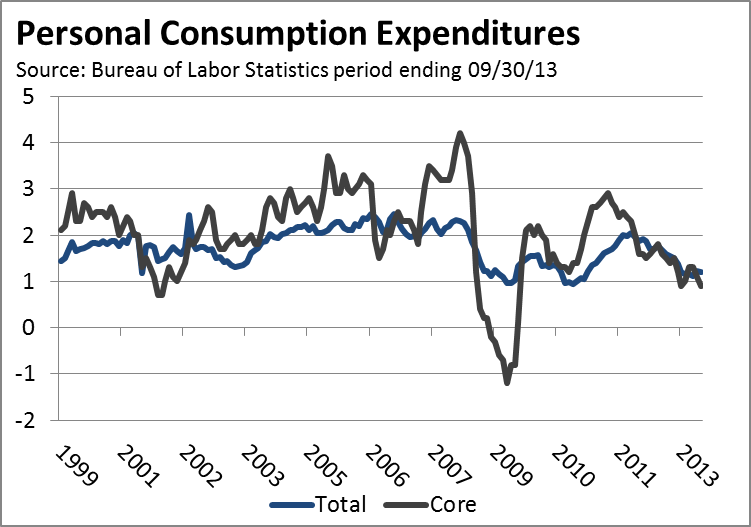
Inflation is below the Fed’s acceptable target of 2.5%, which was increased from 2.0% at the December 2012 FOMC meeting. In September, producer prices were up 1.2% from 2012, while the Consumer Price Index increased only 1.0% in October from 2012, as reported by the Bureau of Labor Statistics. The Personal Consumption Expenditures Deflator, which is the Fed’s preferred inflation barometer, was up only 0.9% from September 2012. Equally important, each of these inflation indicators has been trending lower since the first half of 2011, which suggests the risk of deflation is increasing despite QE3.
 The Federal Reserve initially said it would consider paring back its QE3 purchases when the unemployment rate fell below 7.0%. Although the unemployment rate declined to 7.0% in November from 8.3% a year ago, the labor market is far from good. Overall, 10.9 million Americans remained unemployed in November, and another 7.7 million are working part time but desire full-time work, according to the Labor Department. The number of workers in the labor force, as measured by the participation rate, is 63.0%%, the second-lowest monthly figure since 1978. The Fed has acknowledged the broad weakness in the labor market and has decided to lower its unemployment rate threshold from 7.0% to 6.5%, with some FOMC members suggesting it could be lowered to 6.0%. As Federal Reserve Board of Governors Vice Chair Janet Yellen stated before the Senate’s Committee on Banking, Housing and Urban Affairs on November 14, the labor market and economy are “performing far short of their potential.” Yellen reiterated that the FOMC’s assessment of QE3 remains data dependent, and admitted that QE3 “cannot continue forever, that there are costs and risks associated with the program, and we are monitoring those very carefully. The longer this program continues, the more we will need to worry about these risks.” However, at this point Yellen believes “the benefits exceed the costs.”2
The Federal Reserve was a spectator as the dot-com bubble blew valuations in the stock market to the moon and when housing prices became unhinged from median income while lending standards evaporated. Naturally, after five years of 0% interest rates and trillions in quantitative easing, Yellen was asked during her Senate nomination testimony about asset bubbles. Her overall assessment was the following: “At this point, I don’t see a risk to financial stability, although there are limited signs of a reach for yield.”3 According to the Investment Company Institute, of all the money that has been invested in bond funds since 1986, 60% of the total has been invested in just the last four years. The enormous bond inflows during the last four years suggest investors have been manically lunging for yield, rather than simply reaching for yield. It should be noted that this inflow occurred with bond yields providing their lowest return of the past 27 years, so the capital risk versus reward is asymmetrically tilted toward risk. A modest increase in interest rates can easily wipe out more of a bond investor’s capital than the annual income received from the investment. According to platform provider Dealogic, almost $900 billion of high-rated bonds have been sold through October of this year, the most since 1995 when they began keeping records. If the current pace continues, this year will top last year’s record issuance of $1.01 trillion in debt. Corporations have been able to sell this record volume of debt because demand is high from investors desperate for yield. Recently, the spread between corporate and Treasury bonds was 1.32%, just above 1.30% reached on May 22, before the onslaught of tapering talk upset the bond market. In late October, the Financial Times reported the revival of “payment-in-kind toggle” bonds, which let borrowers pay interest in more debt if they don’t have the cash to make the interest payment. Sounds like a debt Ponzi scheme reminiscent of the heady days of 2007 when covenant–lite loans were the rage. Despite these signs of excess in the credit market, the Federal Reserve is unlikely to heed W. C. Fields advice: “If at first you don’t succeed, try, try again. Then quit. No use being a damn fool about it.”
As for the stock market, Yellen acknowledged at the Senate Committee meeting that “stock prices have risen pretty robustly.” But at current valuations the stock market is “not in a territory that suggests bubble like conditions.”4 On the surface this appears accurate, since the S&P 500 Index is selling at 16 times 2013 earnings. However, a number of factors suggest that earnings aren’t as solid as they might appear and have been boosted by tailwinds that may diminish in coming quarters. Profit margins are at an all-time high, in part because companies are not hiring or increasing wages. According to the Bureau of Economic Analysis, as of September 30, 2012, corporate profits were 14.2% of national income, the highest since 1950. Workers’ earnings were only 61.7% of national income, the lowest since 1966. The pace of hiring and wage increases haven’t changed much since September 2012, so these figures are still representative of the current climate. Through the efforts of the Federal Reserve, interest rates have been historically low for a number of years, which has enabled corporations to significantly lower interest expense. According to MacroMavens, a macroeconomic research provider, interest expense in 2013 will be approximately $169 billion, down from $488 billion in 2007. Interest expense is more likely to rise in coming years, as interest rates become normalized with historical averages. Corporations have purchased more than $800 billion in stock through buybacks over the last two years, with $120 billion occurring in the second quarter of 2013. As the number of shares outstanding are reduced, earnings per share increase, which lowers a company’s price-earnings (P/E) ratio. According to J. P. Morgan, 60% of the increase in earnings since 2011 has come from stock buybacks, rather than organic growth. Since companies have been able to borrow so cheaply, some of these purchases were funded by the $2 trillion in corporate debt issued during the last two years. Buying back stock may improve short-term results (making stock options held by company executives more valuable), but not investing in research and development for long-term future growth is not good for most companies or our country.
Corporate earnings have also benefited from the widespread use of adjusted operating earnings, rather than Generally Accepted Accounting Principles (GAAP), which are more conservative since they allow less wiggle room in how some items are expensed. According to Standard & Poor’s, 2012 total earnings per share for the companies in the S&P 500 would have been $86.51 under GAAP accounting, rather than the $96.82 in operating earnings as reported by some companies. In effect, operative earnings were overstated by as much as 11.9% as compared to GAAP earnings. If the same pattern holds for 2013, the S&P 500’s P/E ratio is closer to 17.9 than 16.0.
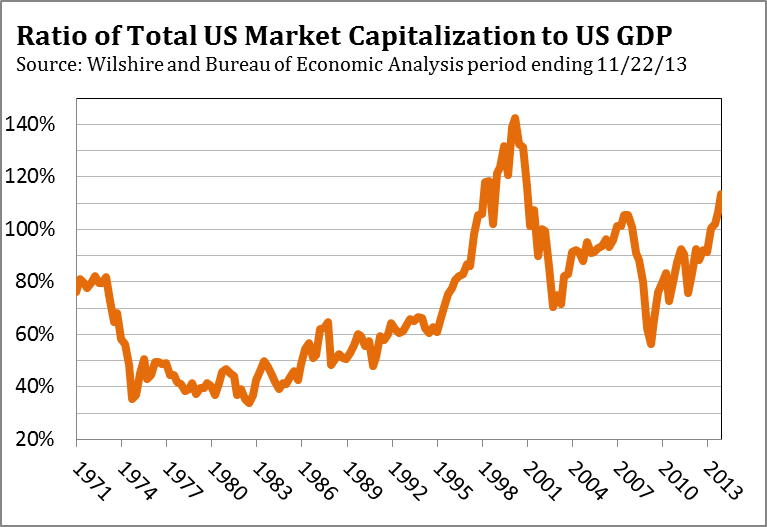
In addition to the special factors that have padded earnings in recent years, other methods of calculating valuation suggest the stock market isn’t as “fairly” valued as the S&P 500’s P/E ratio suggests. As discussed in last month’s commentary, Nobel Laureate James Tobin’s Q ratio is currently near levels when the market has been overvalued in the past—1906, 1929, 1937 and 1968. A similar valuation assessment is revealed by Nobel Laureate Robert Shiller’s cyclically adjusted price-earnings (CAPE) ratio, which is currently almost 50% above its 142-year long-term average. The only instances when the stock market was more expensive were in 1929 and 1999-2000. Another valuation method that also indicates the market is modestly expensive compares the stock market capitalization to GDP. As of November 19, the stock market’s capitalization as measured by the Wilshire 5000 Total Market Index was $18.9 trillion, which is 112.3% of GDP ($16.85 trillion) as of September 30. This level is higher than 96% of all the market days since World War II. In a Fortune magazine interview in 2001, Warren Buffett said the percentage of total market cap relative to the U.S. GDP is “probably the best single measure of where valuations stand at any given moment.”5 No surprise then that last month Warren Buffett said he was having trouble finding stocks to buy.
 Bubbles are determined by an extreme level of valuation, and while it’s clear the market is not currently in a bubble, the market is getting progressively more disconnected from economic fundamentals as it moves higher. The path to a market bubble is shaped by a one-way mentality that dismisses the possibility of risk, while assuming the current trend will continue well into the future in a straight line. In 1999-2000, technology stocks doubled as momentum fed off the concept of a “new paradigm.” Home prices soared 50% above their long-term relationship with median income between 2000 and 2006 as buyers were certain home prices would only continue to rise. Today, the one-way mentality is provided primarily by monetary policy, with an assist from corporate stock buybacks, and a general improvement in the global economy. Many investors believe that as long as the Fed maintains QE3, there is no reason to sell. It is why each correction has been so shallow since the June low, and why the market has gone virtually straight up since the Fed said on September 18 it wasn’t tapering. The lack of reasons to sell has reduced selling pressure to very low levels, so it doesn’t take much buying pressure to lift stock prices. If investors believe the Federal Reserve will maintain QE3 well into 2014, the market could experience a melt up that would push the stock market closer to bubble territory. In her Senate testimony, Janet Yellen said she would not hesitate to prick a bubble if one were to develop. “No one who lived through that financial crisis would ever want to risk another one.”6 She may be tested in the near future.
The Federal Reserve has forecast that GDP will accelerate in 2014 to above 3.0%, which is the same forecast made in 2012 and 2013. If GDP does not pick up as forecast, Janet Yellen made her position clear in her testimony: “I consider it imperative that we do what we can to promote a very strong recovery.”7 Even through the Fed has not succeeded in establishing a strong recovery after five years of extraordinary monetary accommodation, Yellen made it clear the Fed will try and try again. At some point Yellen and the other members of the FOMC may have to consider what Albert Einstein said about extreme persistence: “Insanity is doing the same thing over and over again and expecting different results.”
U.S. Economy
In January of this year, the Federal Reserve forecast that the economy would accelerate in the second half of the year, with GDP growth rising to 3.0% or better. The consensus among private economists was the pickup in the economy would occur as the impact of the tax increases in January diminished. Our view was that growth in 2013 would hover near 2.0%, and wouldn’t accelerate to 3.0% as forecast, since we didn’t see a catalyst that would boost job and income growth to offset the drag from higher taxes and the sequester. Although the Commerce Department reported that third quarter GDP rose to 3.6% from 2.5% in the second quarter, the headline number was a bit misleading.
As we have discussed in prior commentaries, real final sales is a more consistent assessment of the economy’s health than GDP, since final sales provide a cleaner indication of demand. Changes in inventories either add or subtract from the quarterly GDP estimates, and have a tendency to make the economy look stronger or weaker than it really is. In the third quarter, businesses made significant increases to their inventories, which added 1.7% to GDP. After such a big boost to inventory levels in the third quarter, businesses probably won’t add to their existing inventory as much in the fourth quarter. If this proves true, the decline in inventory additions in the fourth quarter from the third quarter will be subtracted from fourth quarter GDP. The swings in inventories represent a level of noise that final sales ignore. In the third quarter real final sales, which is GDP less changes in private inventories, were up 1.9% versus a gain of 2.1% in the second quarter. Based on real final sales, the economy didn’t strengthen at all during the third quarter. The GDP headline gave the appearance of acceleration from the second quarter, since it included the 1.7% boost from inventories.
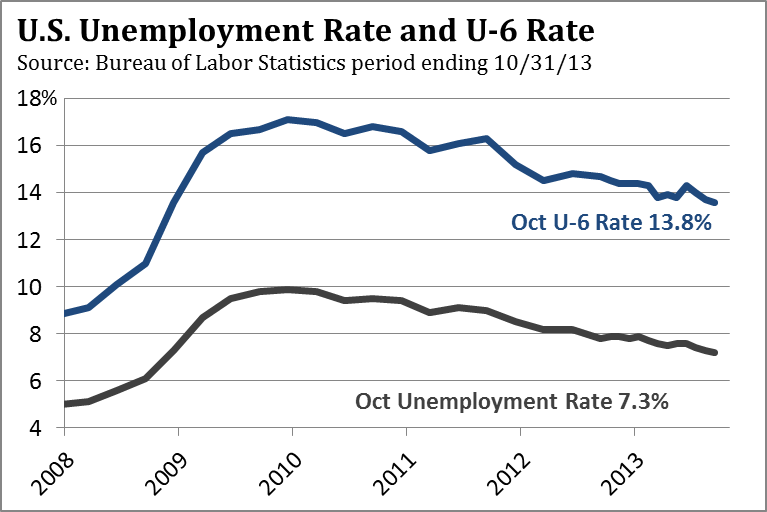 In November, job growth increased to 203,000 new jobs, which lifted the monthly average for 2013 to 195,000 jobs from the 185,000 average in 2012. Even after including the better numbers of the last four months, job growth since November 2012 was up a modest 1.7%. According to the Labor Department, average hourly earnings increased 0.1% in November and have increased 2.0% over the last year, which is less than the rise in the cost of living for many consumers. The unemployment rate dropped to 7.0% from 7.3%, and the underemployment rate fell to 13.2% from 13.8%. The underemployment rate includes those working part time, but who want a full-time job. However, there are still 10.9 million people unemployed and the number of long-term unemployed (out of work for more than 27 weeks) was essentially unchanged in November and totaled 4.1 million. The good news is the labor market isn’t getting weaker. The bad news is it isn’t materially improving.
The disappointing rollout of the Affordable Care Act and the uncertainty consumers and businesses are encountering is likely to extend into the first quarter of 2014. The approval rating of both political parties and the president has made new lows in recent weeks, according to recent polls. The lack of leadership and progress on the many challenges facing our country is apparent in the drop in consumer confidence, which fell to a two-year low in late October. Businesses and consumers are likely to invest less and spend less until more clarity develops around the costs and benefits of the Affordable Care Act, since healthcare represents almost 18% of GDP.
In the last two years, housing has rebounded and auto sales have jumped, as the Federal Reserve continued its extraordinary monetary accommodation. Despite these positives, GDP held around 2.0% in both years. As we enter 2014, mortgage rates are likely to be higher, and the slowdown in housing we discussed in our July commentary is occurring. We have no idea when the Federal Reserve will begin to scale back its QE3 purchases. In a perfect world, the economy will accelerate as the Fed has forecast, making the decision to taper easy. We don’t expect the economy to grow 3.0% anytime soon, which is likely to keep the financial markets hanging, parsing every speech and data point.
Eurozone
 At the beginning of 2013, we thought the eurozone wouldn’t emerge from its recession until the second half of the year. As it turned out, GDP grew 0.3% in the second quarter. As we noted last month, the recovery is likely to be choppy and weak, and in the third quarter, growth slowed to 0.1%. Germany, which represents 30% of eurozone GDP, saw its GDP growth dip to 0.3% from 0.7% in the second quarter. France’s economy actually contracted 0.1%, compared to growth of 0.5% in the second quarter. France’s Purchasing Managers Index, as reported by market data vendor Markit, fell to 48.5 in November from 50.5 in October, so growth appears weak in the fourth quarter as well. The ongoing weakness in the second largest economy within the eurozone led Standard & Poor’s to cut France’s credit rating by one notch to AA on November 8.
The unemployment rate is 11%, and unemployment for those under 25 is 25%. Government spending represents 57% of France’s GDP, which has limited the options available to President François Hollande to narrow France’s budget deficit to less than 3.0% of GDP by 2014. The European Union now estimates France’s budget deficit will be 3.7% in 2015. The tax increases President Hollande has pushed through have hurt growth, and he has yet to propose anything to promote growth.
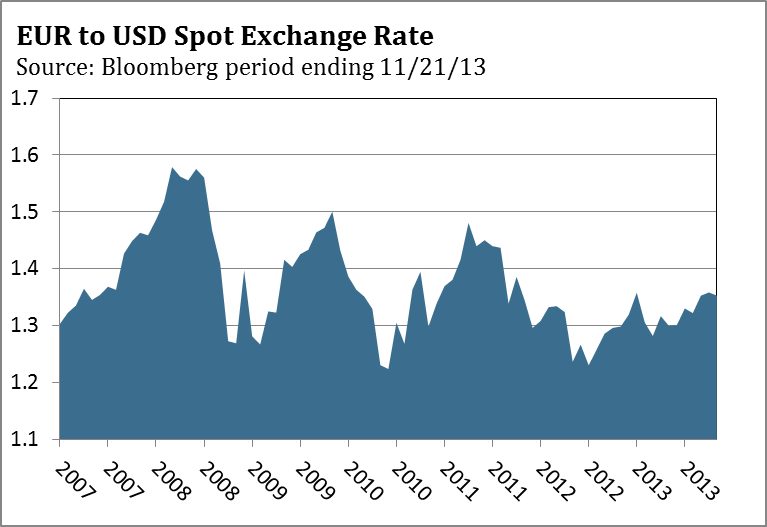 On November 7, the European Central Bank (ECB) lowered its refinancing rate from 0.50% to 0.25%. The move was spurred by continued weakness in the eurozone and a decline in inflation. In October, inflation fell to just 0.7%, which is well below the ECB’s target of 2.0%. This decline increased concerns that deflation may become a threat, although ECB President Mario Draghi dismissed the risk of deflation when he stated, “If we mean by deflation a self-fulfilling fall in prices, we don’t see that. We may experience a prolonged period of low inflation. I don’t think it is similar to Japan.”8 With interest rates now barely above 0%, the ECB’s options to spur growth are limited, since it can’t follow the lead of other central banks and implement quantitative easing. We think the ECB will encourage a decline in the value of the euro, which could boost growth through more exports. Although a lower euro would help Germany, it would also help Portugal, Spain and Italy increase exports and GDP growth. Germany has been criticized recently for its record current account surplus, which would likely increase if the euro declines. However, as ECB President Draghi noted, “The answer to the problems of the Euro area is not to weaken its stronger economies. Rather it is to strengthen its weaker economies.”9
We expect the euro to weaken in 2014 from 135.00 to 128.00, with an even lower value a real possibility. Greece will likely require a third bailout and Portugal’s current bailout expires in mid-2014. If these bailouts don’t go smoothly, the euro could break support near 127.00 and head toward 120.00.
Stocks
Since the low in March 2009, the S&P 500 has continued to make higher highs and higher lows, which is the definition of an uptrend. Until the S&P 500 drops below a prior low, the major trend is up. The market has benefited from a lack of reasons to sell, which has kept selling pressure very low. Most money managers and mutual fund managers are bottom-up investors, looking for companies with solid balance sheets, strong management teams and opportunities to grow their businesses over the next three to five years. With the overall macro environment looking relatively stable, there are no macro factors currently giving investors a reason to sell. However, there are a number of issues that could elevate macro concerns in 2014. The Federal Reserve may choose to reduce QE3 purchases even if the economy is not as strong as forecast, the unemployment rate is higher than desired and inflation is lower than its 2.5% target. European growth is likely to remain abysmal, which could exacerbate tensions between Germany and southern European countries that are enduring depression levels of youth unemployment. Greece and Portugal are likely to require another bailout package and face more austerity measures to receive additional financial assistance that could prove very unpopular. Should the Fed begin to lower its QE3 security purchases, India, Brazil, Indonesia, Turkey and other developing nations could experience another period of weakness in their respective currency. This currency weakness could result in higher inflation and additional rate increases by central banks to deal with a plunging currency and inflation, as they did last summer.
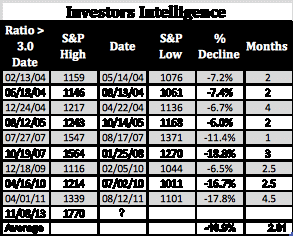
 Investors know that the stock market has done well when the Fed’s quantitative easing program has been active. Investors are also likely to remember that the stock market declined after the Fed ended QE1 and QE2. If the Federal Reserve provides clarity regarding the timing of tapering their QE3 purchases, investors are likely to take some profits off the table before the Fed begins to taper, rather than waiting to see if the market holds up. The lack of concern regarding macro issues and the belief the Fed will continue QE3 has spawned a rise in bullishness that suggests a measure of caution is warranted. According to the weekly surveys of investor sentiment by Investors Intelligence, the number of bullish investors has exceeded the number of bears by more than three to one. In the nine prior instances that bulls exceeded bears by greater than a three to one margin since 2004, the stock market has experienced a correction of at least 6.0% in the following two to four-and-a-half months. Inflows into equity mutual funds and equity exchange-traded funds are likely to top $450 billion in 2013, more than the previous four years combined, according to the Investment Company Institute. In contrast to the overall level of bullishness of investors, corporate officers and directors are buying fewer shares of their company’s stock than at any time since 1990, according to research at the University of Michigan. They have found that corporate officers and directors have greater insight into their company’s prospects than any other group of investors. The lack of buying is a negative for the market and especially for the telecom, industrial goods and technology sectors where selling is the most intense.
 Technically, the market is still in good shape. Our proprietary Major Trend Indicator suggests any correction is likely to be in the 4-7% range. Although the number of stocks making new 52-week highs has contracted since May, the ratio of new highs to new lows is still OK. The NYSE Advance/Decline Line has also recently made a new high. As long as selling pressure remains muted, the market is not likely to experience a large decline until there are more signs of technical weakness and a reason to sell materializes. Since stocks have performed far better than bonds in 2013, money managers will need to lower their equity exposure as they rebalance their client portfolios. This mechanical process may start the correction we expect in the first quarter of 2014.
Bonds
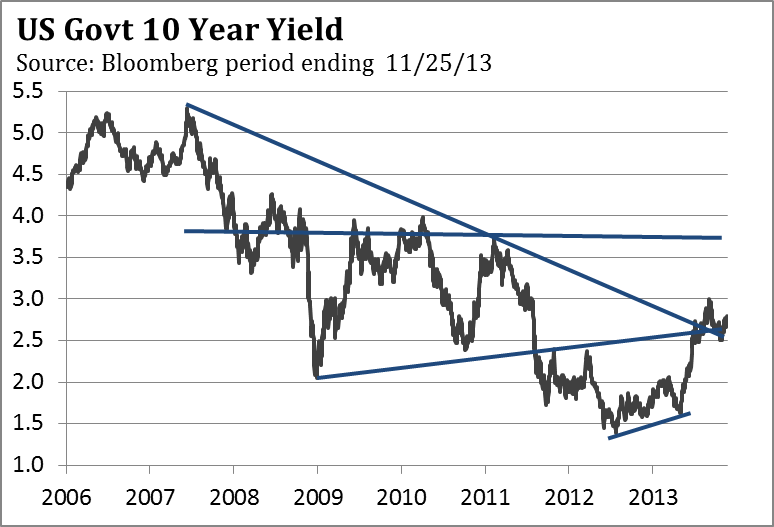 If the Fed continues QE3 through the end of the year, the yield on the 10-year Treasury bond is likely to hold under 3.0%, which was the high it reached in early September. The real test will come when the Fed decides to begin to taper, possibly at the March 2014 FOMC meeting. If the bond market becomes convinced that tapering will begin in March, yields will climb well before the announcement. If the 10-year Treasury yield exceeds 3.00%, the next target is 3.50% to 3.75%, which was the February 2011 yield high.
Jim Welsh, David Martin, Jim O’Donnell
Macro Strategy Team
Definition of Terms
10-Year Treasury is a debt obligation issued by the U.S. Treasury that has a term of more than one year, but not more than 10 years.
AA is a Standard & Poor’s long-term credit rating that reflects a bond issuer’s financial strength, or its ability to meet its financial commitments in a timely fashion. AA is the second highest rating and is given when an issuer’s capacity to meet its long-term debt obligations is very strong.
Consumer Price Index (CPI) is an index number measuring the average price of consumer goods and services purchased by households. The percent change in the CPI is a measure of inflation.
Covenant-lite loan is a type of loan whereby financing is given with limited restrictions on the debt-service capabilities of the borrower.
Cyclically adjusted price-earnings (CAPE) ratio is the ratio of stock prices to the moving average of the previous 10 years’ earnings, deflated by the Consumer Price Index.
Federal funds rate is the interest rate at which a depository institution lends immediately available funds to another depository institution overnight.
Federal Open Market Committee (FOMC) is the branch of the Federal Reserve Board that determines the direction of monetary policy.
Mortgage-backed security (MBS) is a type of asset-backed security that is secured by a mortgage or collection of mortgages.
NYSE Advance/Decline Line is a technical indicator that plots changes in the value of the advance-decline index over a certain time period.
Personal Consumption Expenditure Deflator measures the average change over time in the price paid for all consumer purchases.
Price-earnings (P/E) ratio is a valuation ratio of a company’s current share price compared to its per-share earnings.
Purchasing Managers Index (PMI) is an indicator of the economic health of the manufacturing sector. PMI is based on five major indicators: new orders, inventory levels, production, supplier deliveries and the employment environment.
Q ratio is a ratio devised by Nobel Laureate James Tobin that suggests that the combined market value of all the companies in the stock market should be about equal to their replacement costs.
Quantitative easing (QE) refers to a form of monetary policy used to stimulate an economy where interest rates are either at, or close to, zero.
S&P 500 Index is an unmanaged index of 500 common stocks chosen to reflect the industries in the U.S. economy.
Valuation is the process of determining the value of an asset or company based on earnings and the market value of assets.
Wilshire 5000 Total Market Index represents the broadest index for the U.S. equity market, measuring the performance of all U.S. equity securities with readily available price data.
One cannot invest directly in an index.
RISKS
Investing involves risk, including possible loss of principal. The value of any financial instruments or markets mentioned herein can fall as well as rise. Past performance does not guarantee future results.
This material is distributed for informational purposes only and should not be considered as investment advice, a recommendation of any particular security, strategy or investment product, or as an offer or solicitation with respect to the purchase or sale of any investment. Statistics, prices, estimates, forward-looking statements, and other information contained herein have been obtained from sources believed to be reliable, but no guarantee is given as to their accuracy or completeness. All expressions of opinion are subject to change without notice.
Jim Welsh is a registered representative of ALPS Distributors, Inc.
Forward Funds are distributed by Forward Securities, LLC.
©2013 Forward Management, LLC. All rights reserved.
1 Barron’s Streetwise, “Heads, You Win – Tails, You Win,” November 16, 2013.
2 Board of Governors of the Federal Reserve, “Janet Yellen’s Confirmation Hearing Testimony Before the U.S. Senate’s Committee on Banking, Housing, and Urban Affairs,” November 14, 2013.
3 Federal Reserve, “Yellen’s Confirmation Hearing Testimony,” November 14, 2013.
4 Federal Reserve, “Yellen’s Confirmation Hearing Testimony,” November 14, 2013.
5 Fortune, “Warren Buffet on the Stock Market,” December 10, 2001.
6 Federal Reserve, “Yellen’s Confirmation Hearing Testimony,” November 14, 2013.
7 Federal Reserve, “Yellen’s Confirmation Hearing Testimony,” November 14, 2013.
8 The New York Times, “European Central Bank Makes a Surprise Rate Cut,” November 7, 2013.
9 The New York Times, “France May Slip Back Into Recession,” November 7, 2013.
