
Click for larger chart
Source: JPM Guide to the Markets (updated by me)
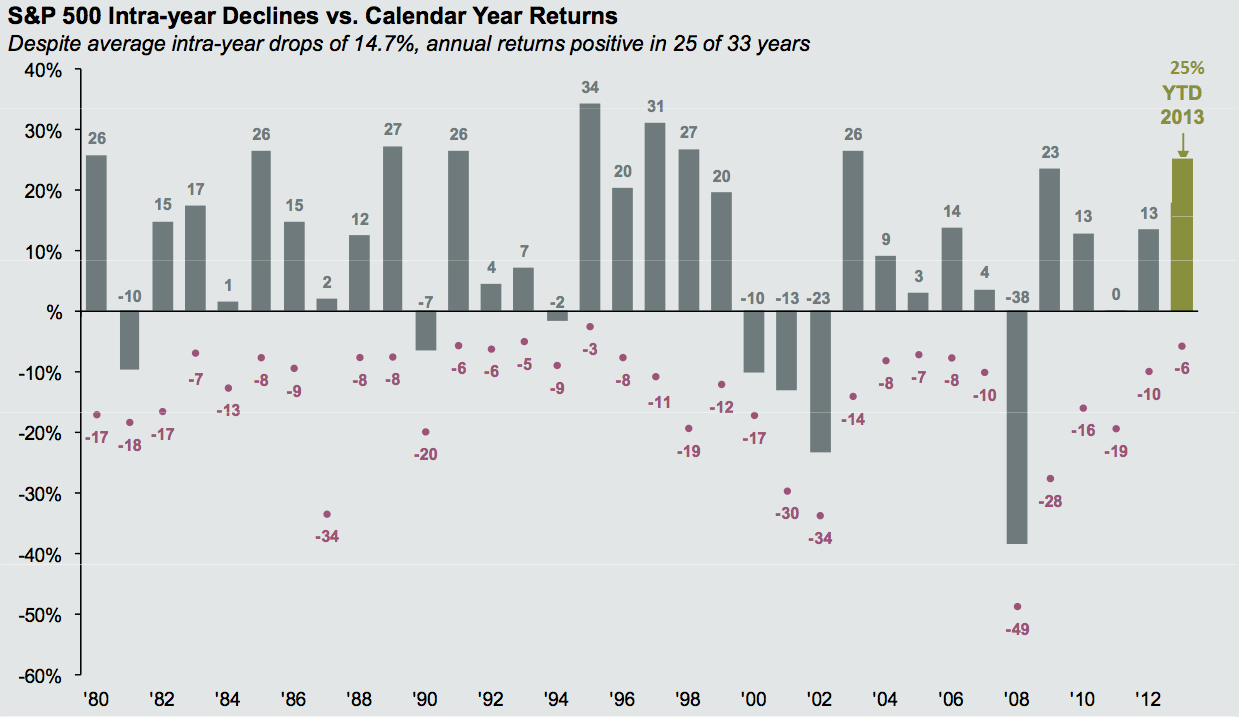
For today’s chart, I wanted to look at something unusual: the intra-year pullbacks of the past few decades.
As this chart (via JPMorgan Chase & Co.) shows, there is an average market drawdown of 14.7 percent. That period includes a few whopper years. Even if we were to back out the outliers — remove the five biggest drawdowns (34 percent, 30 percent, 34 percent, 49 percent and 28 percent — average drawdown of 35 percent within the year), we still see an 11.5 percent average intra-year drop.
Continues here

What's been said:
Discussions found on the web: