
This is an absolutely fascinating — hypnotic even — depiction of what the daily metrics of a New York City Taxi looks like, overlaid on top of a map. You can track passengers, distance traveled, revenue, even tips.
Bravo! I wish we could make the data from our business (Financial planning/asset management) look this compelling!
click for interactive digital
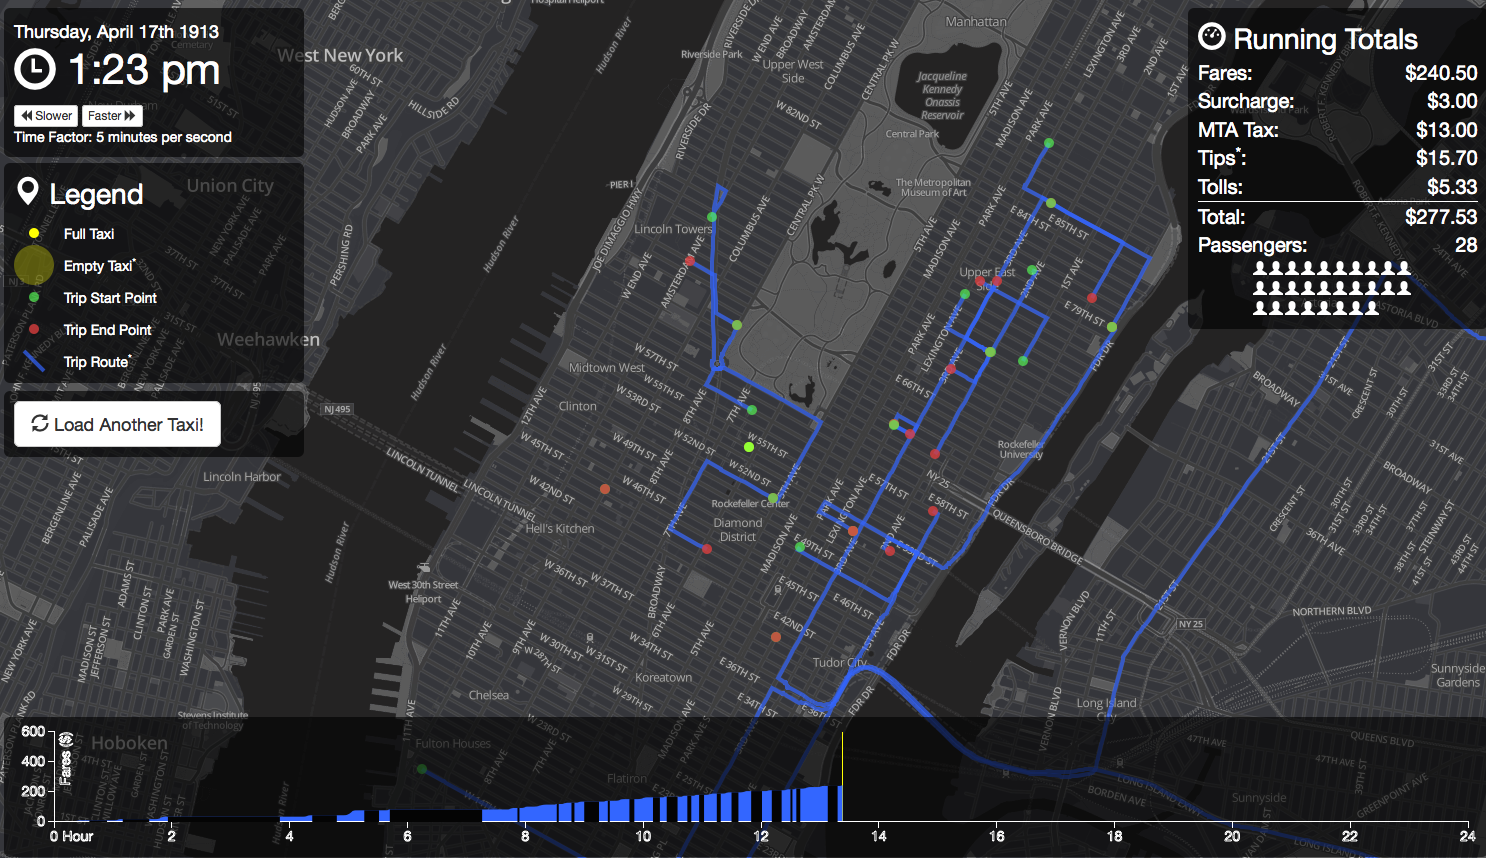
Source: nyctaxi.herokuapp.com
Hat tip fivethirtyeight.com

What's been said:
Discussions found on the web: