This content, which contains security-related opinions and/or information, is provided for informational purposes only and should not be relied upon in any manner as professional advice, or an endorsement of any practices, products or services. There can be no guarantees or assurances that the views expressed here will be applicable for any particular facts or circumstances, and should not be relied upon in any manner. You should consult your own advisers as to legal, business, tax, and other related matters concerning any investment. The commentary in this “post” (including any related blog, podcasts, videos, and social media) reflects the personal opinions, viewpoints, and analyses of the Ritholtz Wealth Management employees providing such comments, and should not be regarded the views of Ritholtz Wealth Management LLC. or its respective affiliates or as a description of advisory services provided by Ritholtz Wealth Management or performance returns of any Ritholtz Wealth Management Investments client. References to any securities or digital assets, or performance data, are for illustrative purposes only and do not constitute an investment recommendation or offer to provide investment advisory services. Charts and graphs provided within are for informational purposes solely and should not be relied upon when making any investment decision. Past performance is not indicative of future results. The content speaks only as of the date indicated. Any projections, estimates, forecasts, targets, prospects, and/or opinions expressed in these materials are subject to change without notice and may differ or be contrary to opinions expressed by others. The Compound Media, Inc., an affiliate of Ritholtz Wealth Management, receives payment from various entities for advertisements in affiliated podcasts, blogs and emails. Inclusion of such advertisements does not constitute or imply endorsement, sponsorship or recommendation thereof, or any affiliation therewith, by the Content Creator or by Ritholtz Wealth Management or any of its employees. Investments in securities involve the risk of loss. For additional advertisement disclaimers see here: https://www.ritholtzwealth.com/advertising-disclaimers Please see disclosures here: https://ritholtzwealth.com/blog-disclosures/
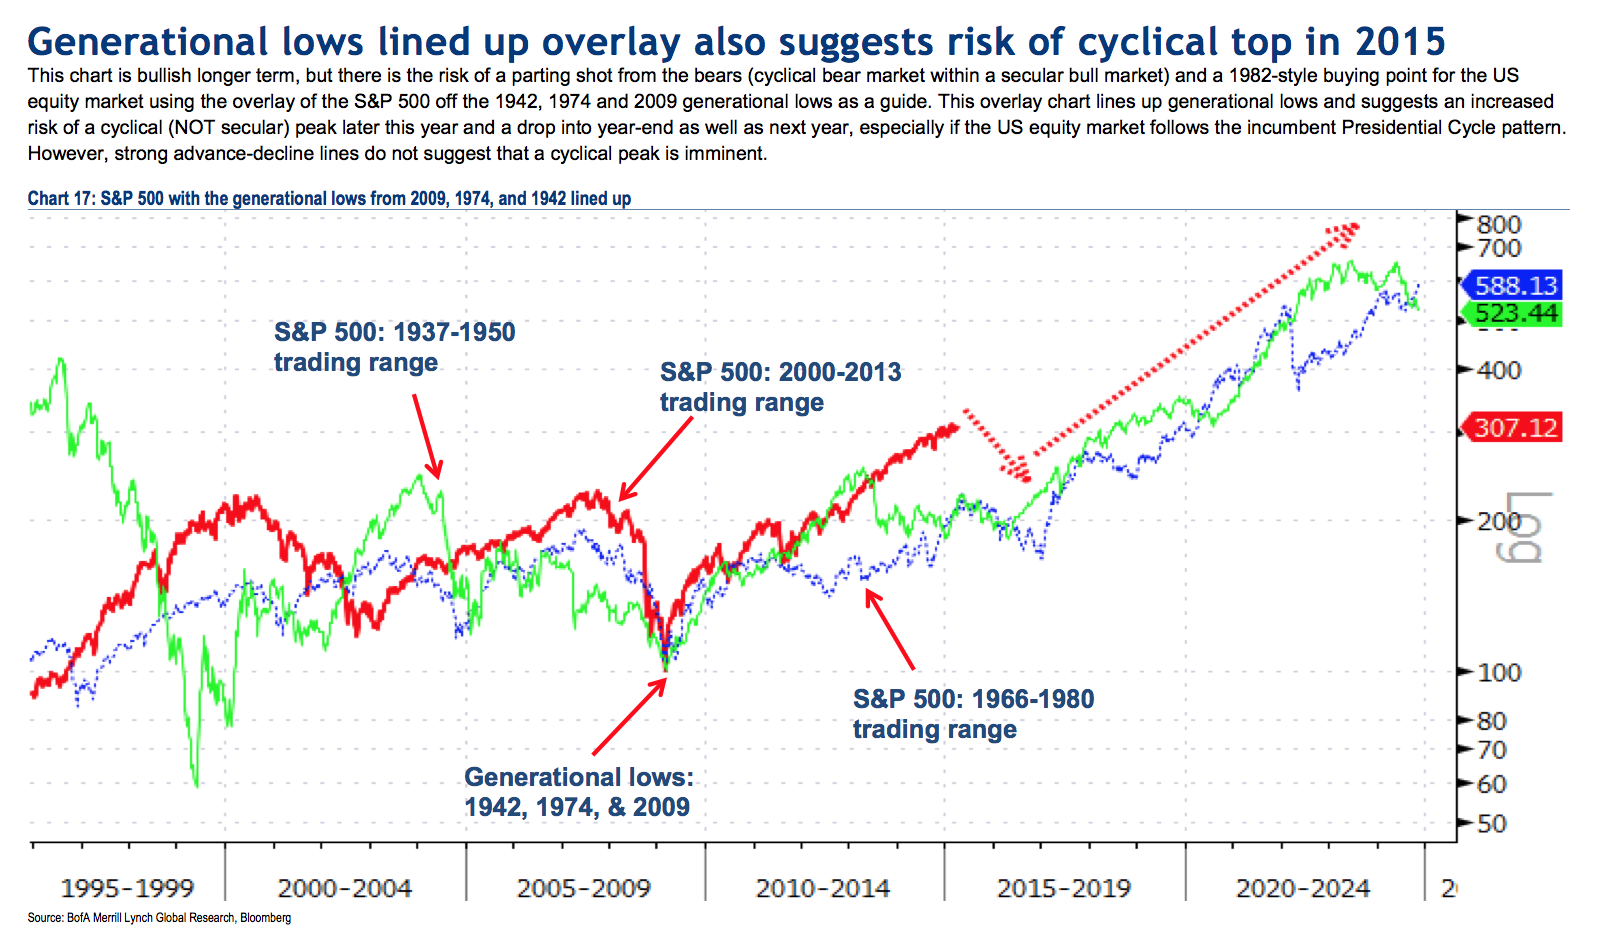
The difference is that valuations (as measured by PE and/or CAPE) during 2009 “generation low” and at present stage of bull market (2015) are significantly higher than during other gen. lows and during the the periods corresponding to 2015. The chart overlay may point to a cyclical top, but considering the market PE, how much higher can the next cyclical bull rise?
Also, imho, if the market drops 20% (i.e. if the Fed lets it go down by 20%), it’s going to drop another 30% in a repeat of 2008.
I have been watching the overall demographic profiles since the late 90s. The current start of the divot in the 40-49 cohort is the primary reason why I think we will remain in the (inflation-adjusted) trading range of the past 15 years. Like CAPE, demographics are pretty useless for predicting short-term peaks and troughs but it is pretty hard to get an order of magnitude lift-off when bucking a major demographic trend. It could be different this time, but I am still planning on fairly low average portfolio returns for the next decade which then kicks into a two-decade long secular bull.
Since Europe, Japan, Russia, and China are all embroiled in pretty abysmal demographics as well (and they really struggle to integrate immigration into their cultures and economies) the only bright spot about investing in those places is that many of those PEs are already average to below average (some are single digits).
I thought we would go flat last year but that did not happen, the indexes continued to roar. One thing I am thinking about this year is that the ultimate sign of a top may be when active managers start to out perform indexes and it looks like that may happen this year.
The world wide middle class is growing and that should long term provide fuel for equities markets world wide. I think that gives US large cap companies that have significant overseas exposure have long term an edge. Our demographic growth is dependent on getting immigration reform done. I think that is more a when than an if. Despite the mighty effort of the Tea Party they are going to be overwhelmed by the demographic change shortly. Their battle was lost forty years ago. It is better to embrace this change and adapt to it. And alone the way make a good profit. I see nothing to fear.
Not enough data for such speculation. Your entire data set is three “generational” events, with two interspersed intervals in a short (by human history terms) span. You cannot tell anything about the periodicity of such few numbers. If such events were randomly distributed over an infinite time span you could tell nothing about periodicity by sampling three events. Our brains are built to seek out meaning for our fears, even if such meaning is not objectively present in the data.
I agree with some of the snarky remarks here. This kind of “analysis” is nothing but spurious pattern seeking – it relies on people’s propensity to search for patterns even when none are there. In this case, I’ll be there is no pattern if one were to perform formal mathematical (statistical) analysis. In other words, it’s all in your heads. Nothing to see here.
Wait, 2015 as the top? What happened to that stock market / farmer’s almanac adage that the 3rd (and 7th) year of a presidency is the best for the market, and it’s the last year going into the first of a new president that are the most dangerous?


The difference is that valuations (as measured by PE and/or CAPE) during 2009 “generation low” and at present stage of bull market (2015) are significantly higher than during other gen. lows and during the the periods corresponding to 2015. The chart overlay may point to a cyclical top, but considering the market PE, how much higher can the next cyclical bull rise?
Also, imho, if the market drops 20% (i.e. if the Fed lets it go down by 20%), it’s going to drop another 30% in a repeat of 2008.
I have been watching the overall demographic profiles since the late 90s. The current start of the divot in the 40-49 cohort is the primary reason why I think we will remain in the (inflation-adjusted) trading range of the past 15 years. Like CAPE, demographics are pretty useless for predicting short-term peaks and troughs but it is pretty hard to get an order of magnitude lift-off when bucking a major demographic trend. It could be different this time, but I am still planning on fairly low average portfolio returns for the next decade which then kicks into a two-decade long secular bull.
Since Europe, Japan, Russia, and China are all embroiled in pretty abysmal demographics as well (and they really struggle to integrate immigration into their cultures and economies) the only bright spot about investing in those places is that many of those PEs are already average to below average (some are single digits).
http://www.frbsf.org/economic-research/publications/economic-letter/2011/august/boomer-retirement-us-equity-markets/
@rd, I’m hoping I can live to the end of that two-decade long secular bull! I’ll be charming the youngsters at the home ;-)
I thought we would go flat last year but that did not happen, the indexes continued to roar. One thing I am thinking about this year is that the ultimate sign of a top may be when active managers start to out perform indexes and it looks like that may happen this year.
I thought the ultimate sign of a top appears 6 months after the actual top.
Usually about 12 months or so.
The world wide middle class is growing and that should long term provide fuel for equities markets world wide. I think that gives US large cap companies that have significant overseas exposure have long term an edge. Our demographic growth is dependent on getting immigration reform done. I think that is more a when than an if. Despite the mighty effort of the Tea Party they are going to be overwhelmed by the demographic change shortly. Their battle was lost forty years ago. It is better to embrace this change and adapt to it. And alone the way make a good profit. I see nothing to fear.
Not enough data for such speculation. Your entire data set is three “generational” events, with two interspersed intervals in a short (by human history terms) span. You cannot tell anything about the periodicity of such few numbers. If such events were randomly distributed over an infinite time span you could tell nothing about periodicity by sampling three events. Our brains are built to seek out meaning for our fears, even if such meaning is not objectively present in the data.
I love charts.
I love finding patterns and predicting the future based on past patterns.
I always get a kick out of looking at patterns like these. Thinking about the future is half the fun of speculation!
I agree with some of the snarky remarks here. This kind of “analysis” is nothing but spurious pattern seeking – it relies on people’s propensity to search for patterns even when none are there. In this case, I’ll be there is no pattern if one were to perform formal mathematical (statistical) analysis. In other words, it’s all in your heads. Nothing to see here.
Wait, 2015 as the top? What happened to that stock market / farmer’s almanac adage that the 3rd (and 7th) year of a presidency is the best for the market, and it’s the last year going into the first of a new president that are the most dangerous?
(meant mostly tongue-in-cheek, but still…)
George W Bush proved that is just toilet paper.