Click to see breakdown of human factors.
Source: Bloomberg
This content, which contains security-related opinions and/or information, is provided for informational purposes only and should not be relied upon in any manner as professional advice, or an endorsement of any practices, products or services. There can be no guarantees or assurances that the views expressed here will be applicable for any particular facts or circumstances, and should not be relied upon in any manner. You should consult your own advisers as to legal, business, tax, and other related matters concerning any investment. The commentary in this “post” (including any related blog, podcasts, videos, and social media) reflects the personal opinions, viewpoints, and analyses of the Ritholtz Wealth Management employees providing such comments, and should not be regarded the views of Ritholtz Wealth Management LLC. or its respective affiliates or as a description of advisory services provided by Ritholtz Wealth Management or performance returns of any Ritholtz Wealth Management Investments client. References to any securities or digital assets, or performance data, are for illustrative purposes only and do not constitute an investment recommendation or offer to provide investment advisory services. Charts and graphs provided within are for informational purposes solely and should not be relied upon when making any investment decision. Past performance is not indicative of future results. The content speaks only as of the date indicated. Any projections, estimates, forecasts, targets, prospects, and/or opinions expressed in these materials are subject to change without notice and may differ or be contrary to opinions expressed by others. The Compound Media, Inc., an affiliate of Ritholtz Wealth Management, receives payment from various entities for advertisements in affiliated podcasts, blogs and emails. Inclusion of such advertisements does not constitute or imply endorsement, sponsorship or recommendation thereof, or any affiliation therewith, by the Content Creator or by Ritholtz Wealth Management or any of its employees. Investments in securities involve the risk of loss. For additional advertisement disclaimers see here: https://www.ritholtzwealth.com/advertising-disclaimers Please see disclosures here: https://ritholtzwealth.com/blog-disclosures/
1) x-axis values can be scaled so the lines match or don’t. Any positive sloping factor can be hindcast to fit. The model is based on non-linear weighted curve fitting to historical data.
2) None of the models based on these factors have been predictive past 5 years. Look through old IPC reports before disagreeing.
3) Try a very long time scale and no amount of curve fitting will match any of the known data to the curve.
I don’t deny that the earth is warming, the sea is rising, the ice has shrunken, carbon dioxide has increased at an unusual rate for decades or that atmospheric carbon dioxide increases global warming and/or decreases global cooling.
The earth has had a warming trend since 1650. The sea has been rising and the ice has been shrinking for much longer. Proxy data acts as a low pass filter, showing the trend without the noise. Calling the recent warming unprecidented is like standing on the beach in Hawaii and calling the biggest wave during that time the biggest wave in history becauseits the biggest one you ever measured.
I do believe history has made idiots of Malthusian doomsters for a very long time, and have gotten themselves into political position to harm humanity. Population Bomb was required reading for college students when it came out. Go read it now. Silent Spring put a stop to the erradication of mosquitos, the leading spreader of Malaria.
“In low-income countries, nearly 4 in every 10 deaths are among children under 15 years, … malaria and tuberculosis collectively account for almost one third of all deaths in these countries” -WHO
More recently, the rate of sea ice has returned to historical trend. http://ocean.dmi.dk/arctic/icecover.uk.php
Examine the chart for more than a second. Look at the error range and then look at the difference between 2010 and 2014. Go read predictions on when the ice will vanish made 2011 to 2014.
We add millions of tons of carbon dioxide pollution to the atmosphere each year.
Carbon dioxide is a gas that increases the retention of heat by the environment.
The average temperature is steadily increasing, even though there are pauses in the yearly increases, but this is a chart of steady increase.
If this were a stock, it would be a stock to buy, because that is what increase looks like in the real world.
Why do we expect to be able to dramatically change the environment (multiplying the level of CO2 is dramatic), but not expect the unintended consequences?
Malthus did not account for the effect of technology, which might be a great way to fix the atmosphere – if there were a technology to decrease the effects of CO2.
Do you know of any such technology that is likely to have anywhere near the effects that agricultural improvements has delayed the anticipated effects of overpopulation?
If there is no technology to anticipate, what do you expect to reverse the effects of our extreme levels of pollution?
Seriously, no kidding? First you complain that the graphs don’t go back to 1650 (although there is no data for most of these parameters going that far back), then you use a two year period to claim that we are back to “trend”. You are as bad as those who (based on the data from two year of 2007, 2008) predicted that the North Pole would be ice free within a decade. Two years of higher or lower than the previous two years do not change a trend. NSIDC provides a fun little tool for those kind of games: http://nsidc.org/arcticseaicenews/charctic-interactive-sea-ice-graph/ try to add in the 4-year period of 2005-8 and “we are all going to die” or (as your little cherry picked link did) add in just 2011-2014 and “we all live in sugar land”. If you want to get all serious (no kidding) and define “trend” in a scientific manner, then look at their news site http://nsidc.org/arcticseaicenews/ and check out the monthly ice extend for the period 1979-2015.
– Interesting set of charts. This is the kind of detailed info I like.
– There’s something I missed. Since say the mid 1980s humans have (literally) cleaned up their act. Less dust & soot exhausted. (That’s by the way, precisely what volcanoes do as well). That resulted in lesser amount of clouds formed & less rain. Less clouds also means that those fewer clouds block less sun warmth/energy from reaching the surface of the earth. Resulting in higher temperatures. That info is the charts as well but that hasn’t been well spelled out too well.
Keywords: “Global Dimming” http://www.dailymotion.com/video/x22692o_bbc-horizon-2005-global-dimming_shortfilms
You should read your own links – the wiki link was quite good:
“The Maunder Minimum roughly coincided with the middle part of the Little Ice Age, during which Europe and North America experienced colder than average temperatures. Whether there is a causal relationship, however, is still controversial, as no convincing mechanism for the solar activity to produce cold temperatures has been proposed,[10] and the current best hypothesis for the cause of the Little Ice Age is that it was the result of volcanic action.[11][12] The onset of the Little Ice Age also occurred well before the beginning of the Maunder minimum”.
Furthermore, even if the Maunder minimum was going to cool the world the human causes of warming would still be problematic. Its just that we would have gotten a little longer time to fix it before things got out of hand.
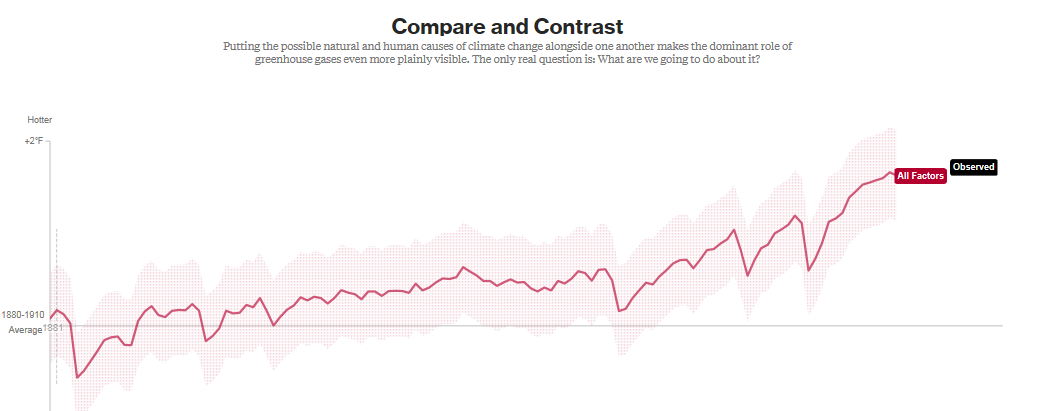


Spectacular way to communicate the results of a complex multivariate model.
You don’t have to be a scientist to understand the import of this graphic.
ADMIN: EDITED TO REDUCE THE SILLINESS
1) x-axis values can be scaled so the lines match or don’t. Any positive sloping factor can be hindcast to fit. The model is based on non-linear weighted curve fitting to historical data.2) None of the models based on these factors have been predictive past 5 years. Look through old IPC reports before disagreeing.
3) Try a very long time scale and no amount of curve fitting will match any of the known data to the curve.
I don’t deny that the earth is warming, the sea is rising, the ice has shrunken, carbon dioxide has increased at an unusual rate for decades or that atmospheric carbon dioxide increases global warming and/or decreases global cooling.
The earth has had a warming trend since 1650. The sea has been rising and the ice has been shrinking for much longer. Proxy data acts as a low pass filter, showing the trend without the noise. Calling the recent warming unprecidented is like standing on the beach in Hawaii and calling the biggest wave during that time the biggest wave in history becauseits the biggest one you ever measured.
I do believe history has made idiots of Malthusian doomsters for a very long time, and have gotten themselves into political position to harm humanity. Population Bomb was required reading for college students when it came out. Go read it now. Silent Spring put a stop to the erradication of mosquitos, the leading spreader of Malaria.
“In low-income countries, nearly 4 in every 10 deaths are among children under 15 years, … malaria and tuberculosis collectively account for almost one third of all deaths in these countries” -WHO
More recently, the rate of sea ice has returned to historical trend.http://ocean.dmi.dk/arctic/icecover.uk.php
Examine the chart for more than a second. Look at the error range and then look at the difference between 2010 and 2014. Go read predictions on when the ice will vanish made 2011 to 2014.
We add millions of tons of carbon dioxide pollution to the atmosphere each year.
Carbon dioxide is a gas that increases the retention of heat by the environment.
The average temperature is steadily increasing, even though there are pauses in the yearly increases, but this is a chart of steady increase.
If this were a stock, it would be a stock to buy, because that is what increase looks like in the real world.
Why do we expect to be able to dramatically change the environment (multiplying the level of CO2 is dramatic), but not expect the unintended consequences?
Malthus did not account for the effect of technology, which might be a great way to fix the atmosphere – if there were a technology to decrease the effects of CO2.
Do you know of any such technology that is likely to have anywhere near the effects that agricultural improvements has delayed the anticipated effects of overpopulation?
If there is no technology to anticipate, what do you expect to reverse the effects of our extreme levels of pollution?
.
Seriously, no kidding? First you complain that the graphs don’t go back to 1650 (although there is no data for most of these parameters going that far back), then you use a two year period to claim that we are back to “trend”. You are as bad as those who (based on the data from two year of 2007, 2008) predicted that the North Pole would be ice free within a decade. Two years of higher or lower than the previous two years do not change a trend. NSIDC provides a fun little tool for those kind of games: http://nsidc.org/arcticseaicenews/charctic-interactive-sea-ice-graph/ try to add in the 4-year period of 2005-8 and “we are all going to die” or (as your little cherry picked link did) add in just 2011-2014 and “we all live in sugar land”. If you want to get all serious (no kidding) and define “trend” in a scientific manner, then look at their news site http://nsidc.org/arcticseaicenews/ and check out the monthly ice extend for the period 1979-2015.
– Interesting set of charts. This is the kind of detailed info I like.
– There’s something I missed. Since say the mid 1980s humans have (literally) cleaned up their act. Less dust & soot exhausted. (That’s by the way, precisely what volcanoes do as well). That resulted in lesser amount of clouds formed & less rain. Less clouds also means that those fewer clouds block less sun warmth/energy from reaching the surface of the earth. Resulting in higher temperatures. That info is the charts as well but that hasn’t been well spelled out too well.
Keywords: “Global Dimming”
http://www.dailymotion.com/video/x22692o_bbc-horizon-2005-global-dimming_shortfilms
– But in the coming years planet earth is becoming cooler again. e.g. “New Maunder minimum”.
https://en.wikipedia.org/wiki/Maunder_Minimum
http://www.livescience.com/51597-maunder-minimum-mini-ice-age.html
And I expect that human causes of warming up the earth are becoming less important in the future.
You should read your own links – the wiki link was quite good:
“The Maunder Minimum roughly coincided with the middle part of the Little Ice Age, during which Europe and North America experienced colder than average temperatures. Whether there is a causal relationship, however, is still controversial, as no convincing mechanism for the solar activity to produce cold temperatures has been proposed,[10] and the current best hypothesis for the cause of the Little Ice Age is that it was the result of volcanic action.[11][12] The onset of the Little Ice Age also occurred well before the beginning of the Maunder minimum”.
Furthermore, even if the Maunder minimum was going to cool the world the human causes of warming would still be problematic. Its just that we would have gotten a little longer time to fix it before things got out of hand.