Chuck Trafton, EDLY ISA
Every now and again, I come across someone I want to interview but they aren’t quite the right fit for MiB. Either the firm is too...

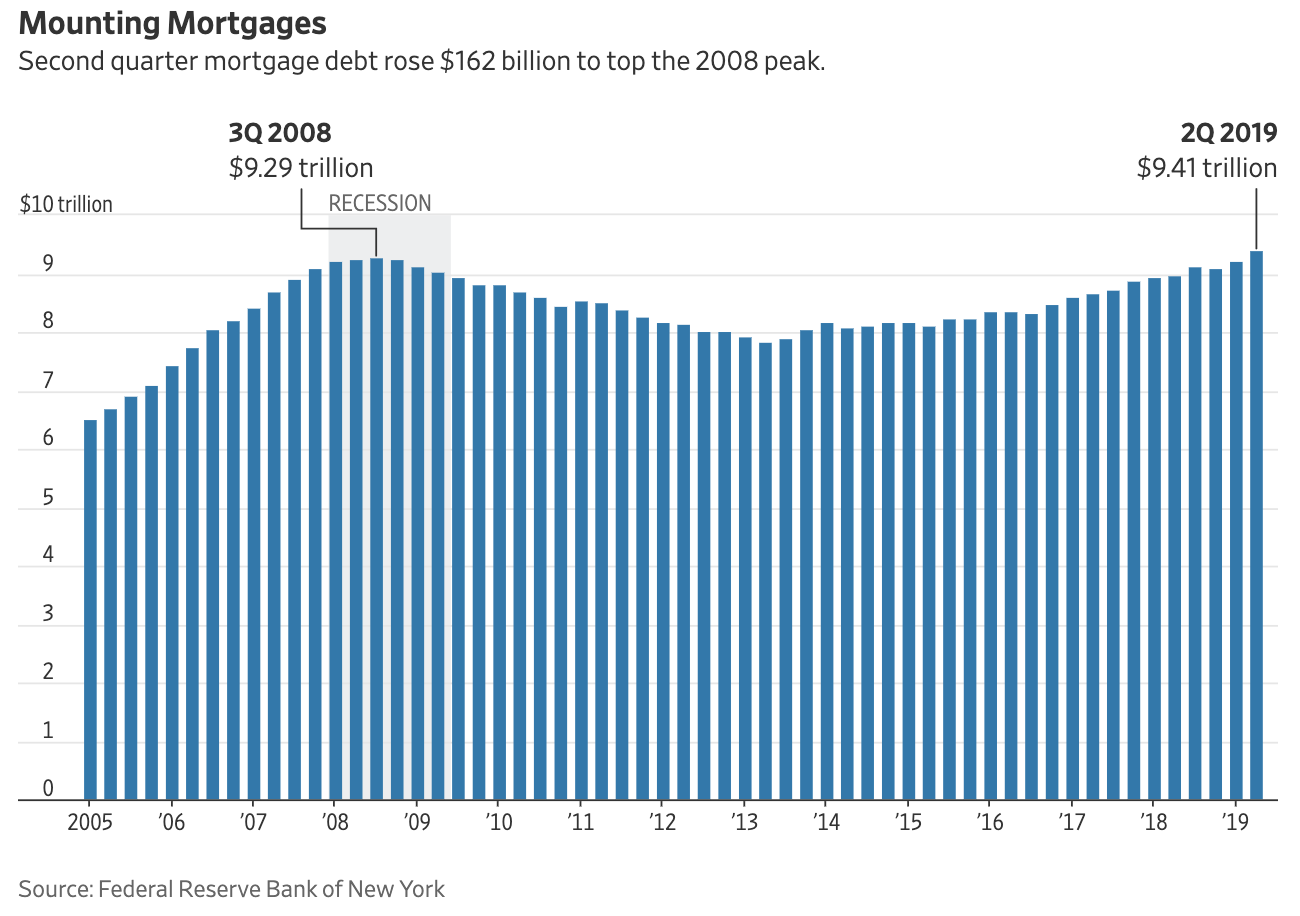 Source: WSJ File this one under more “denominator blindness:” Every now and again, a data point comes along...
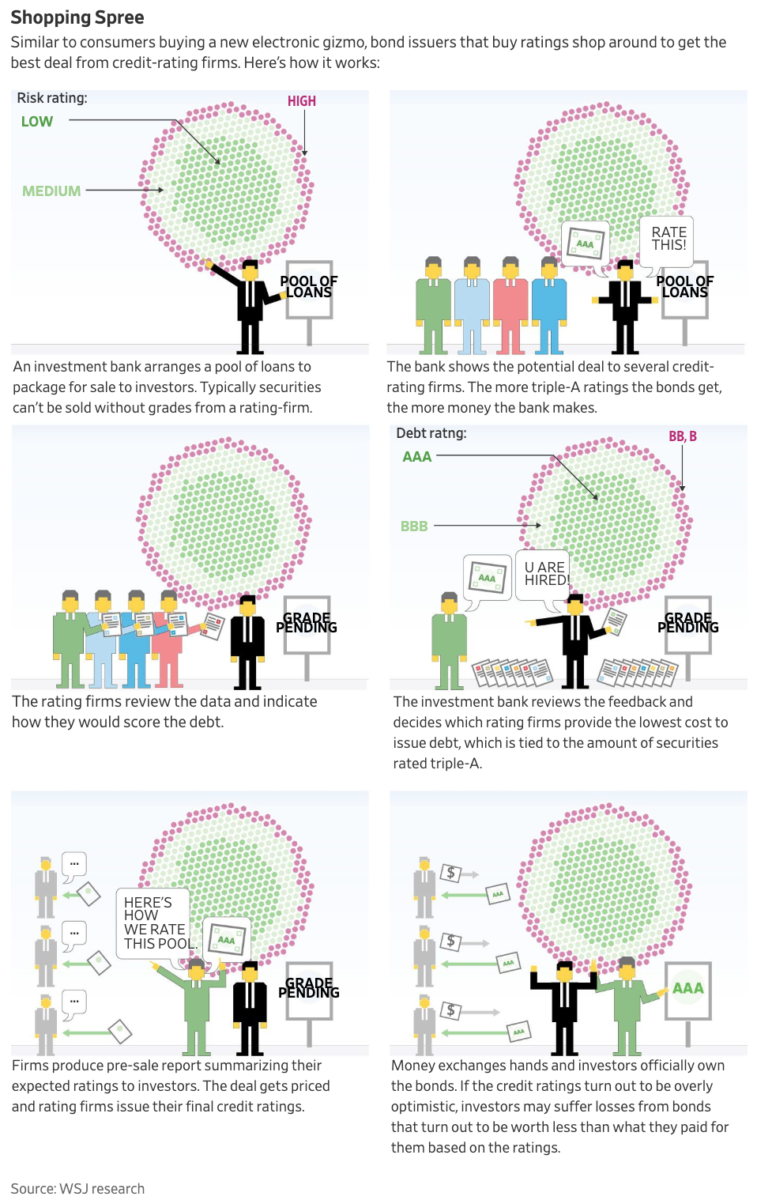 I was away last week when this monster piece came out in the WSJ. This issue has intrigued me since 2007, but for those of you not up to...
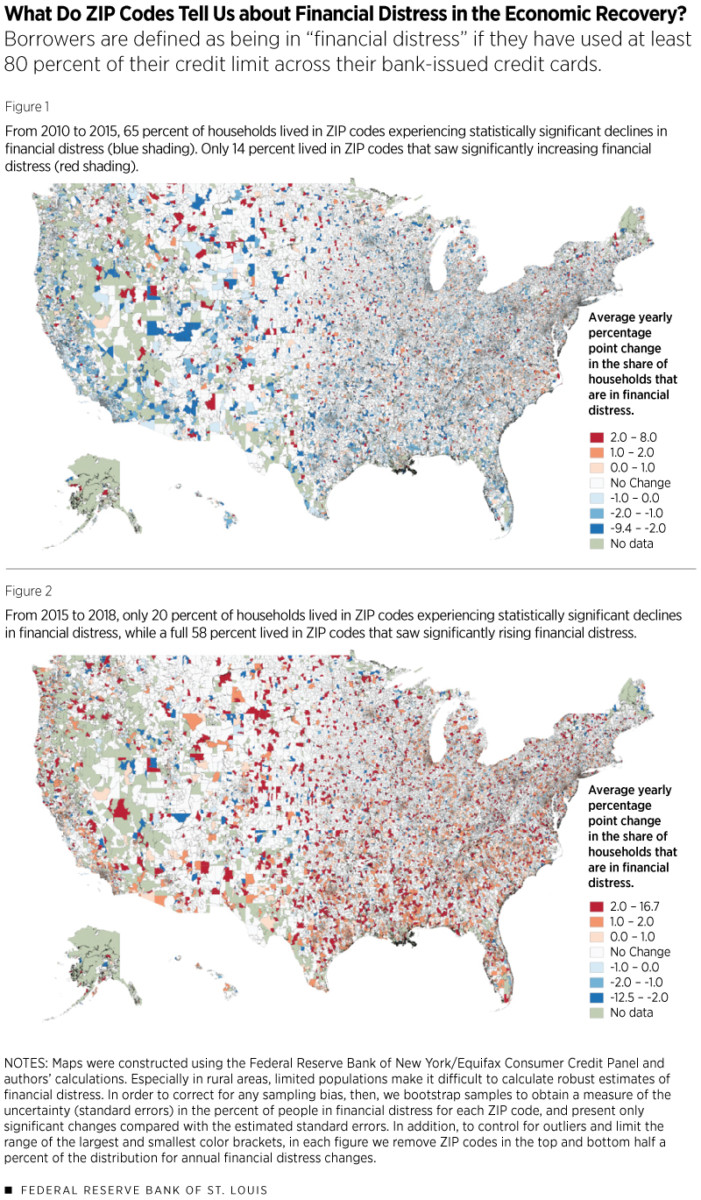 There is a fascinating research piece by the St. Louis Federal Reserve Bank: The Unequal Recovery: Measuring Financial Distress by ZIP...
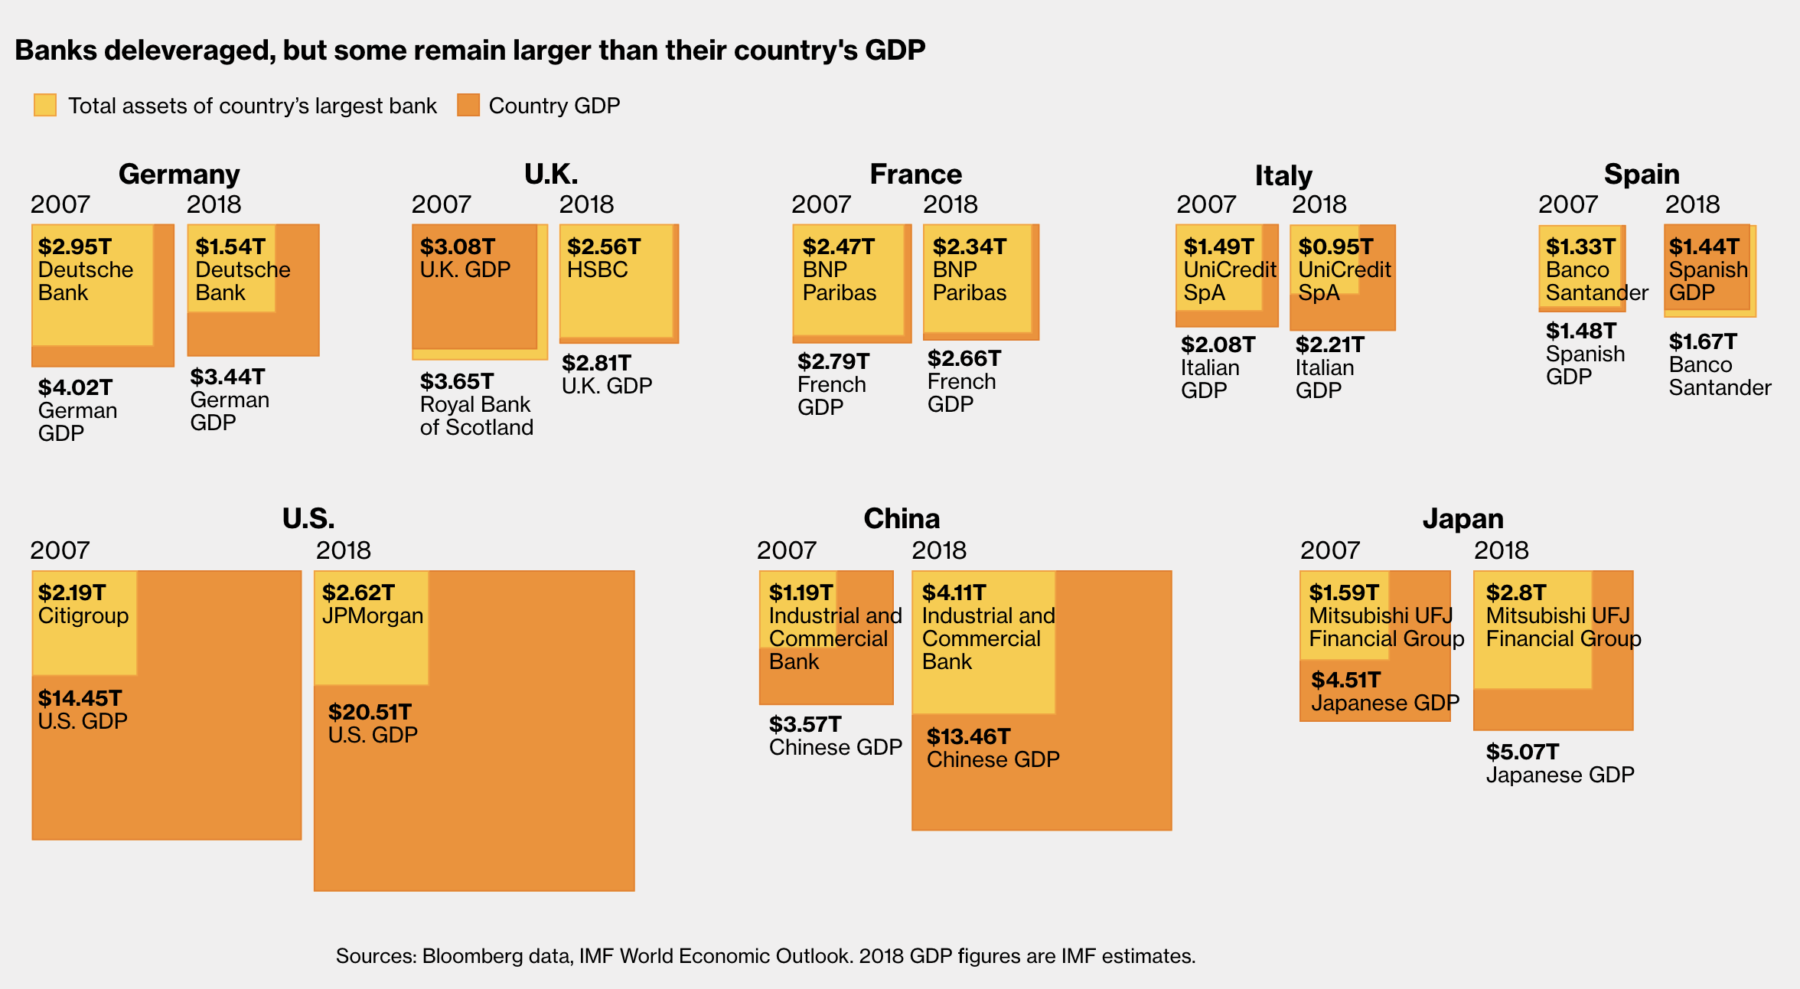 Great collection of charts by John Authers and Lauren Leatherby looking at “The Decade of Deleveraging Didn’t Quite Turn Out That...
Get subscriber-only insights and news delivered by Barry every two weeks.