 The SEC has proposed allowing companies to move to semiannual earnings reporting. On Monday, we discussed why eliminating...
Read More
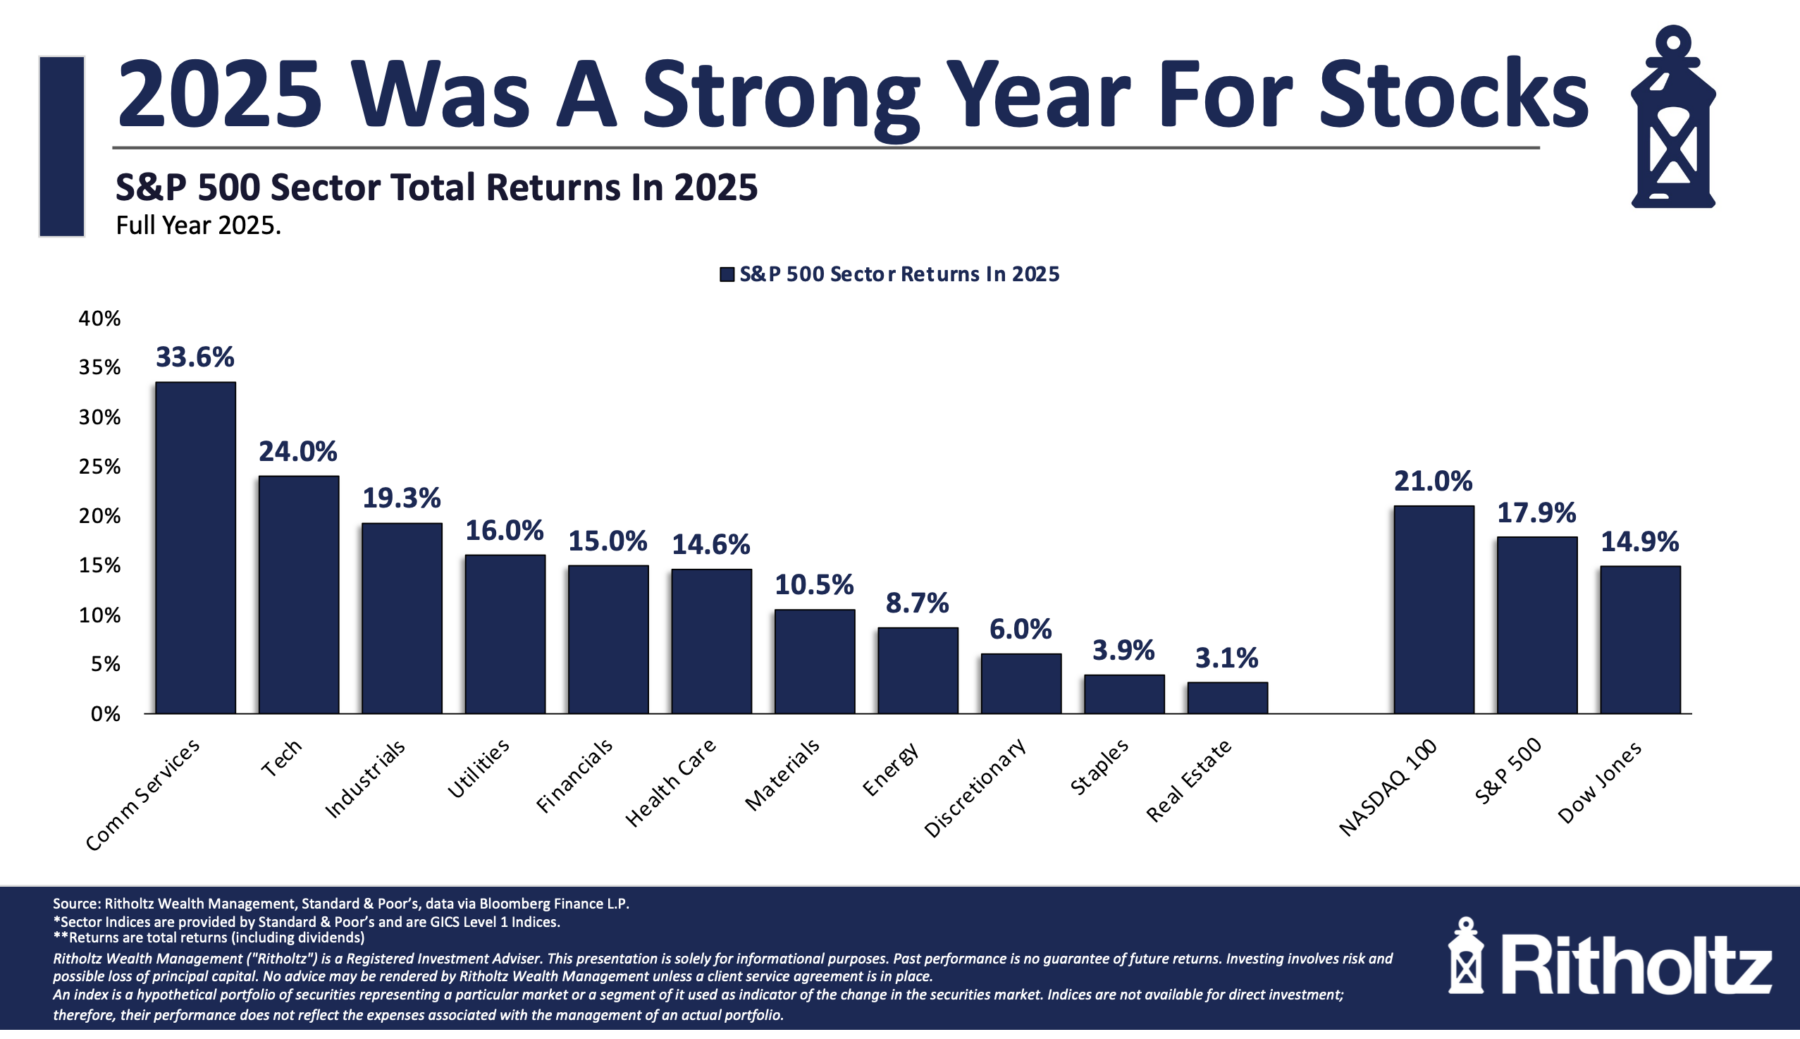 Each quarter, I prepare a detailed deck and call for Ritholtz Wealth Management clients.1 I start with about 100 ideas and...
Read More
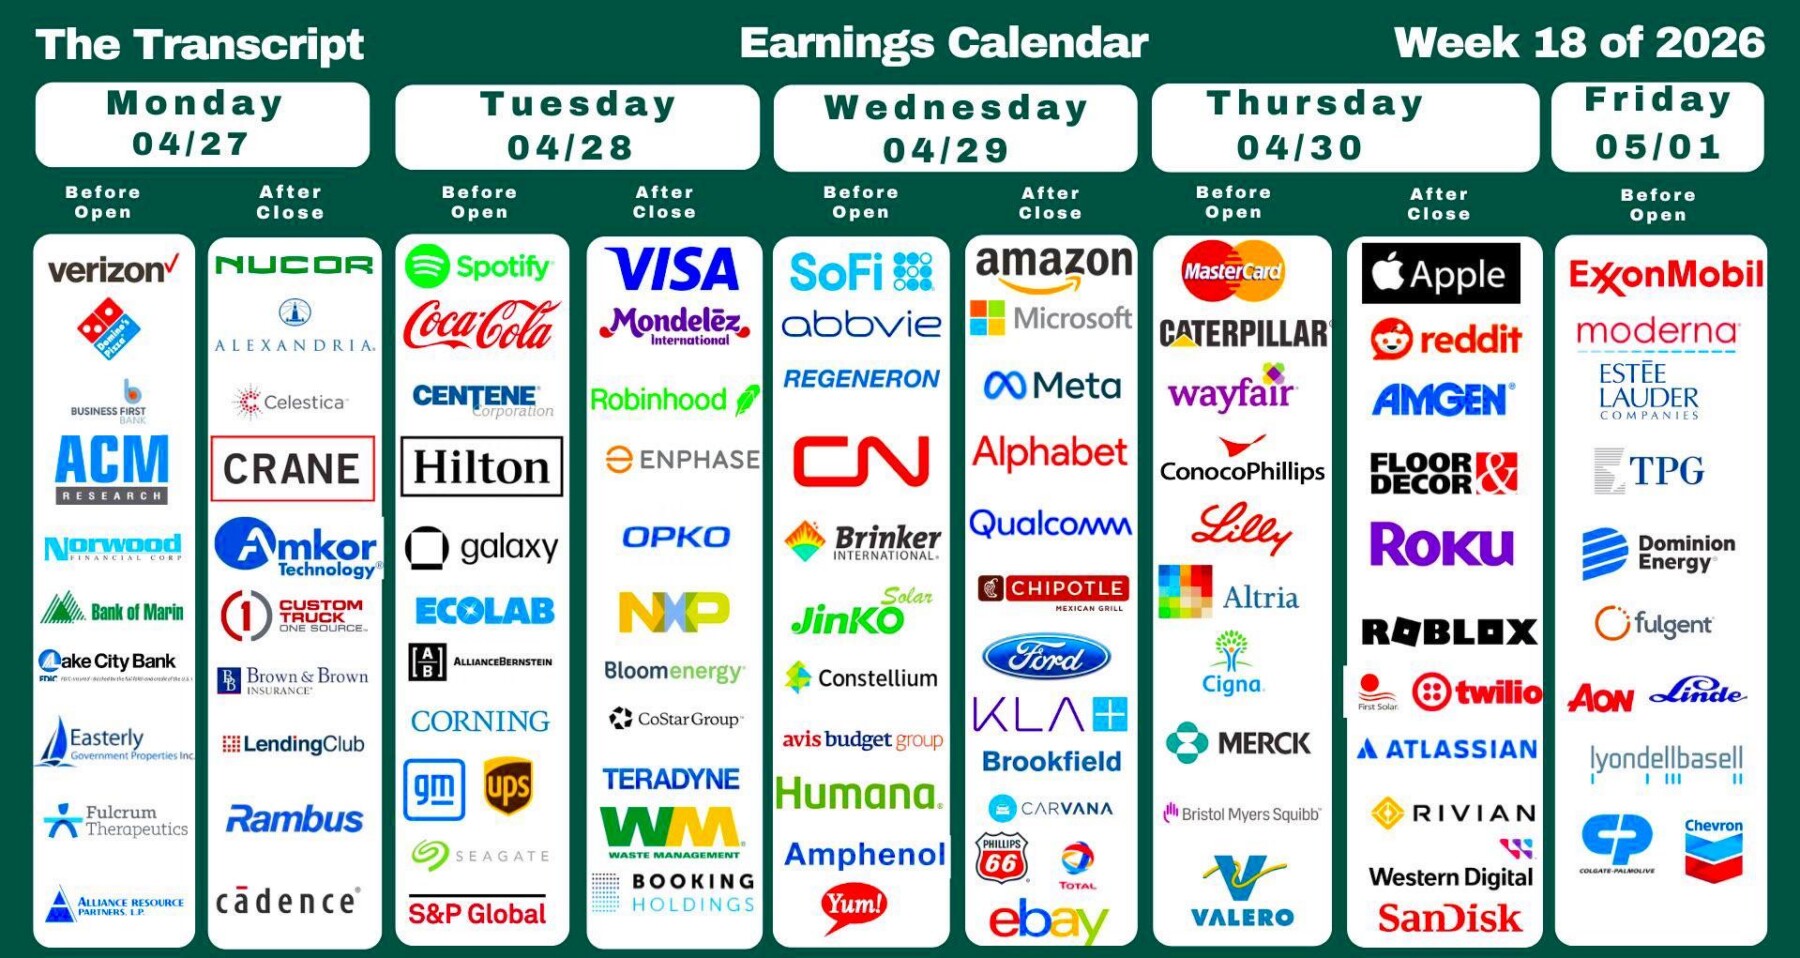
 My RWM colleagues Josh Brown and Michael Batnick do a bang-up job each week diving into the specifics of the newsflow in What Are...
Read More
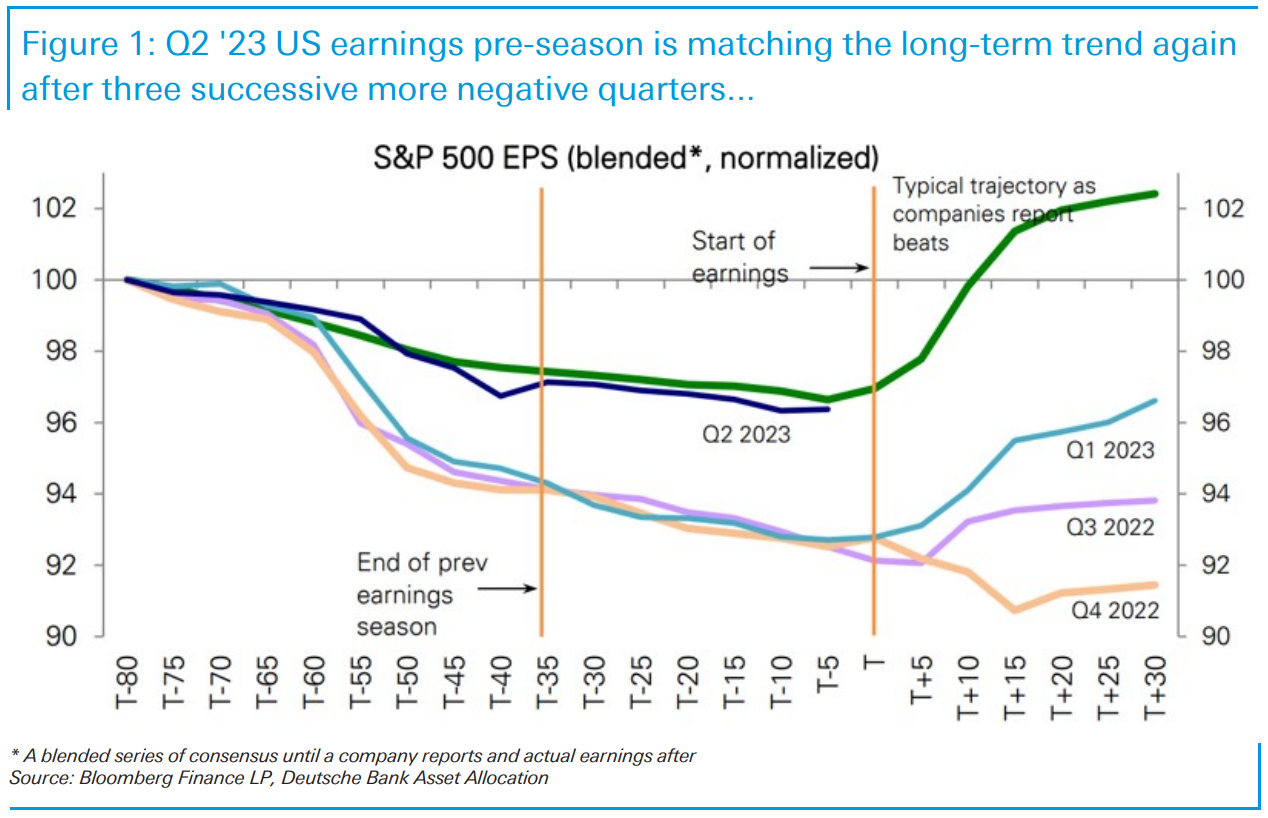 Jim Reid of Deutsche Bank notes the pattern of gradual downgrades before earnings season begins is back to normal. As the rest of...
Read More
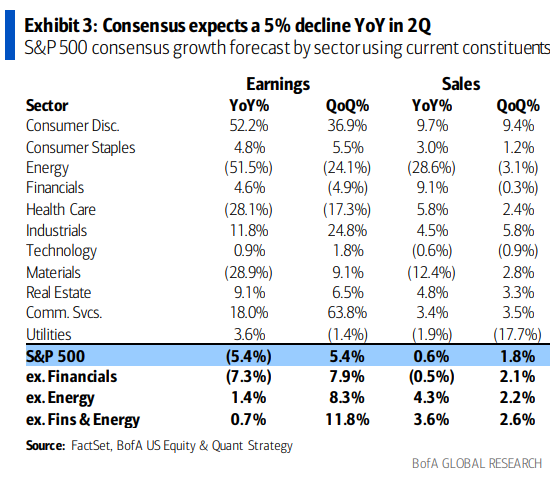
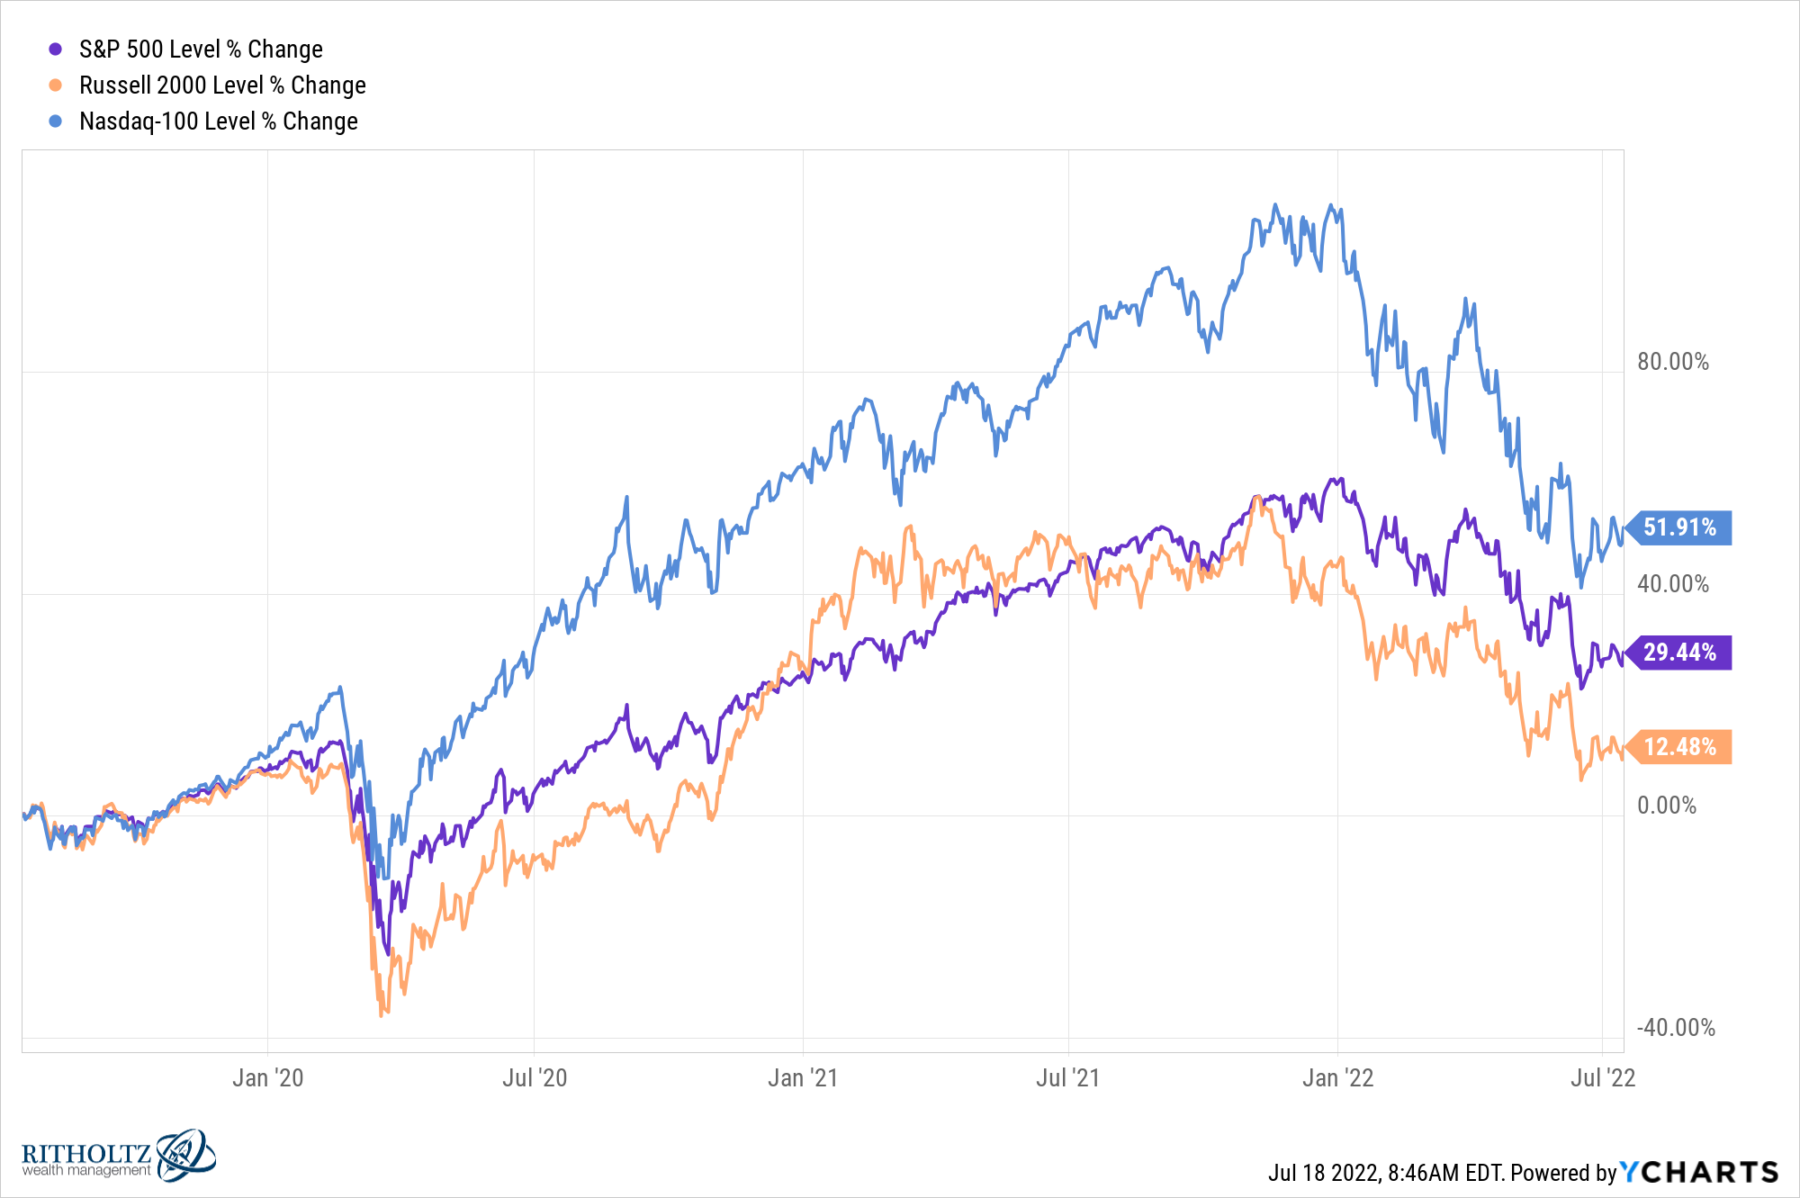 Ignore the emojis in the headline long enough to ask yourself this question: What might the rest of 2022 look like? I did...
Read More
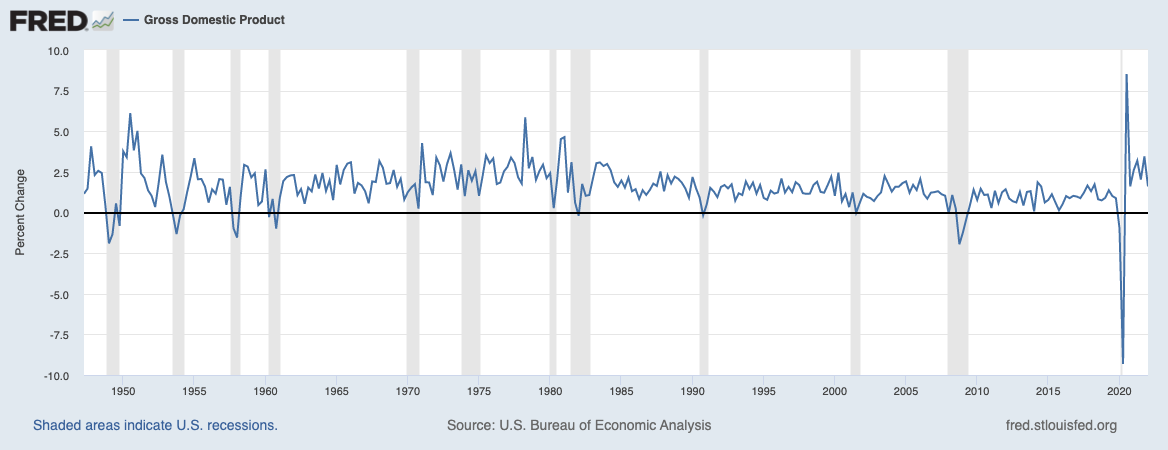 There is some confusion about a) What a recession actually is, and b) Why it matters. Sometimes, ideas we think of as...
Read More
 Source: How Much This is kind of fun: based on data compiled by 2017 US Census Bureau data, what is the value of each...
Read More
Josh and I discuss a recent Bloomberg column of mine — Report Earnings Daily — debating what quarterly earnings report does...
Read More
Reporting Profits Daily Would End Corporate Short-Termism Think there’s too much hoopla about quarterly earnings? Imagine if the circus...
Read More
Reporting Profits Daily Would End Corporate Short-Termism Think there’s too much hoopla about quarterly earnings? Imagine if the circus...
Read More
