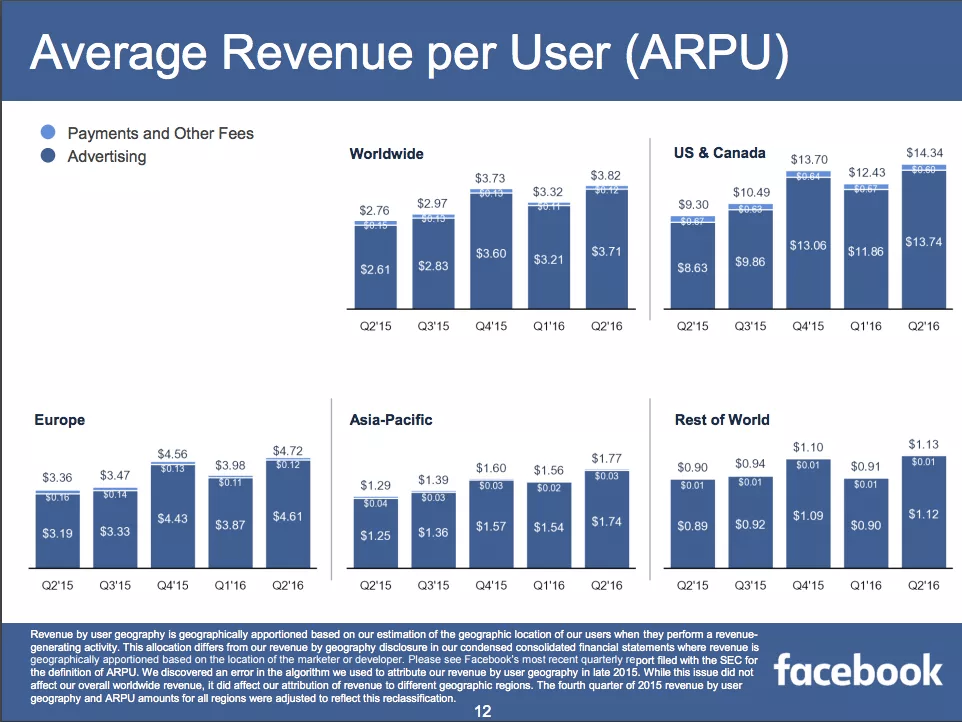
 I have been bullish pretty much this entire market run — from March 2009 to today. But that doesn’t mean I don’t want...
Read More
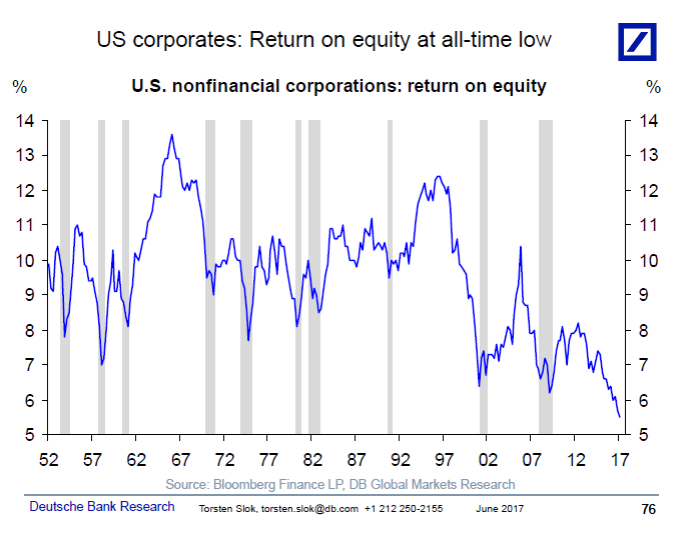
 Another funky graphic: Source: Visual Capitalist
Read More
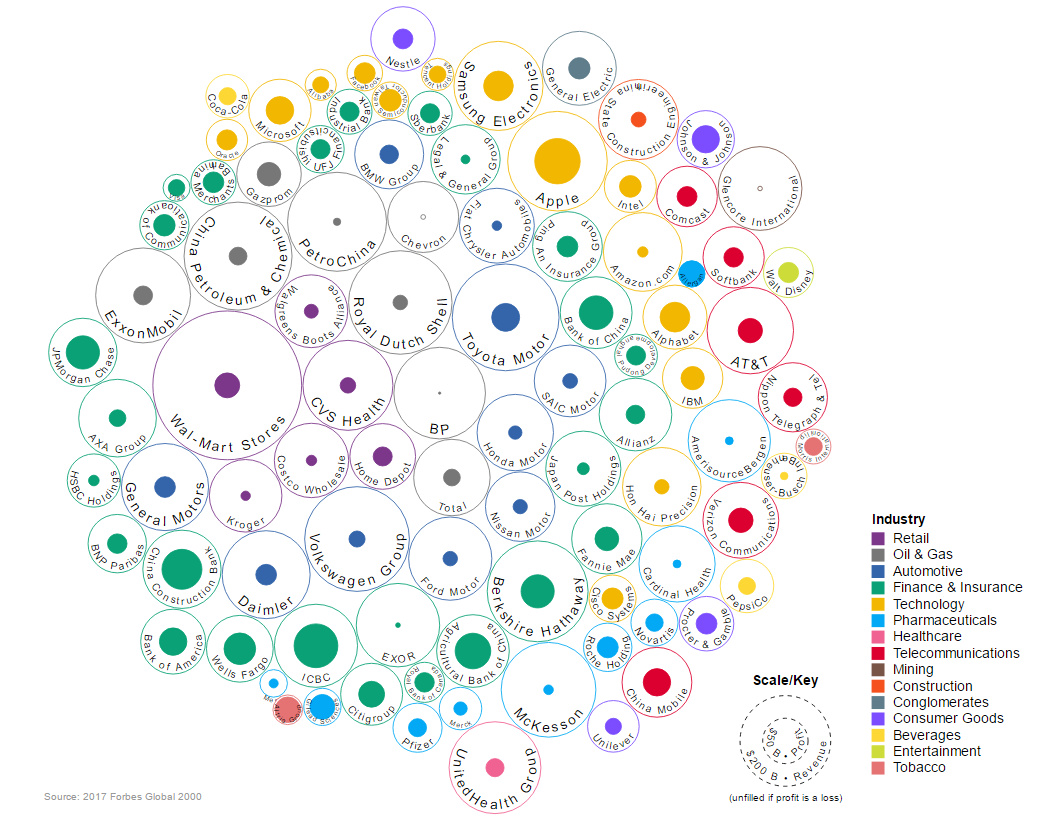
 Fascinating: click for ginormous inforgraphic Source: Visual Capitalist
Read More
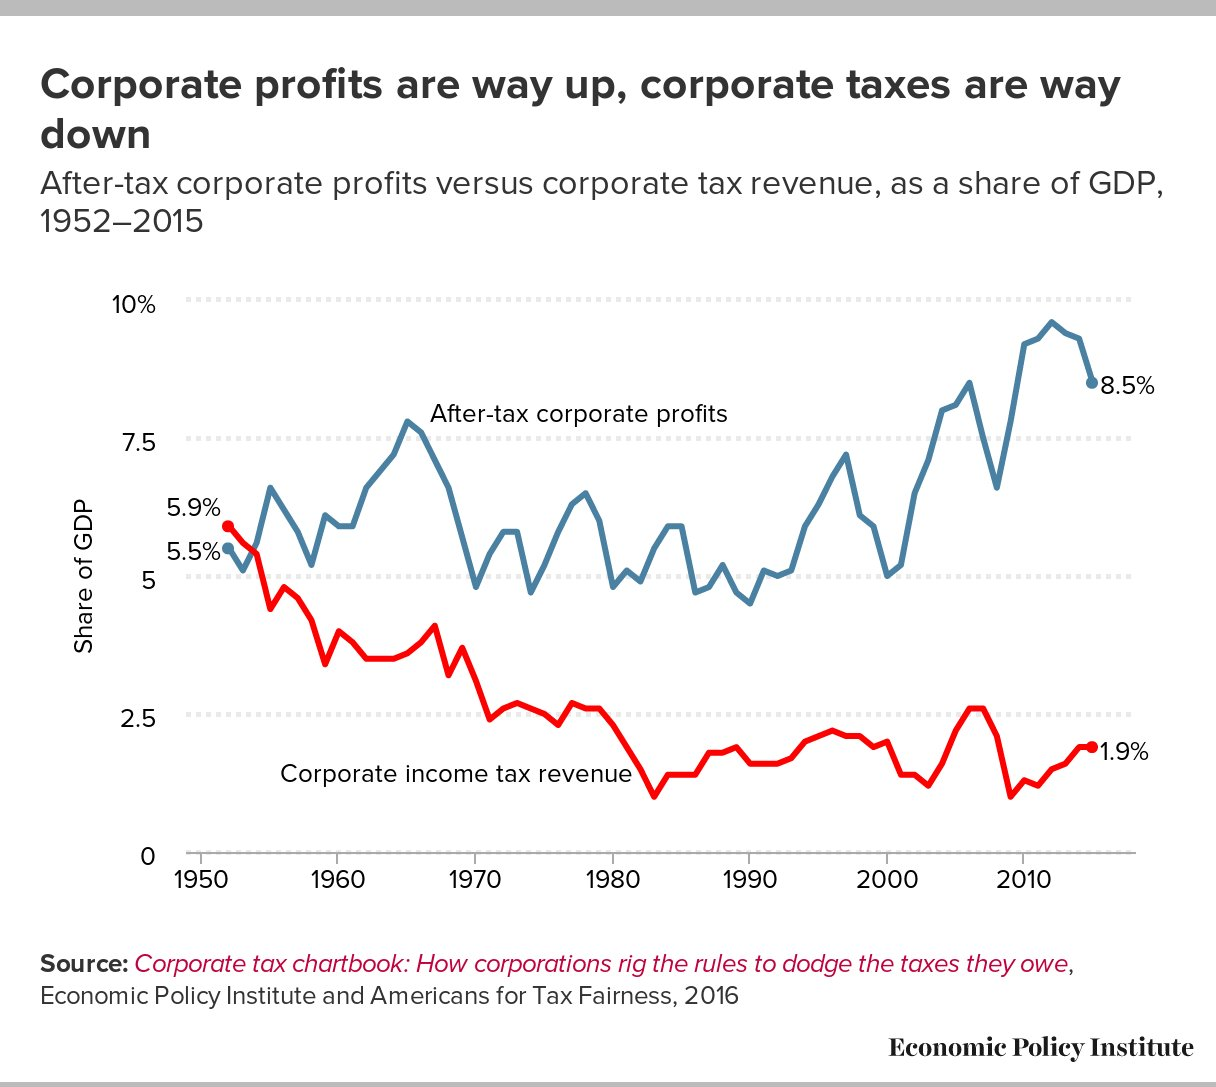 Given the latest tax proposal out if D.C., I thought this was quite relevant: Source: Economic Policy Institute
Read More
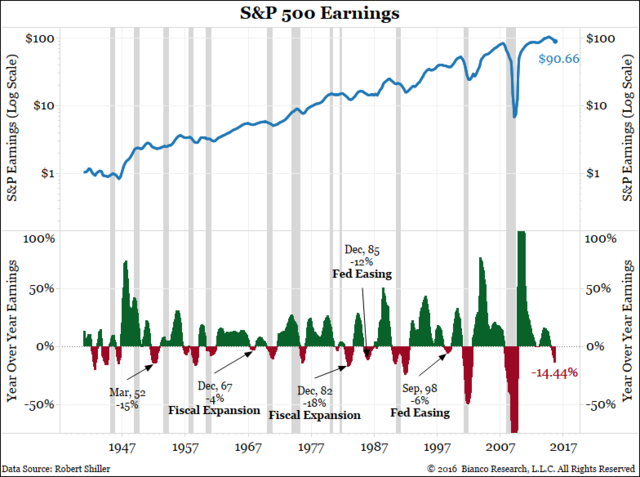
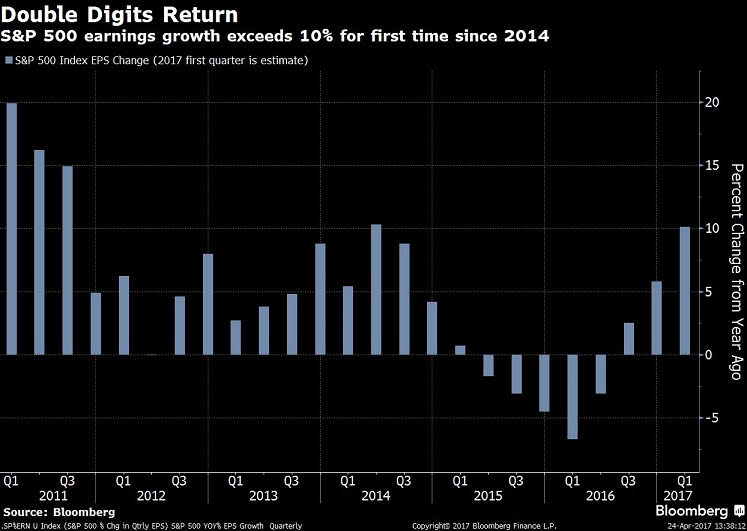 From David Wilson, Bloomberg News: Double-digit earnings growth is back for the S&P 500. The index’s companies are headed for a...
Read More
 James Bianco is president of Bianco Research, an institutional research and analytics firm. Since November 1990, he has been...
Read More
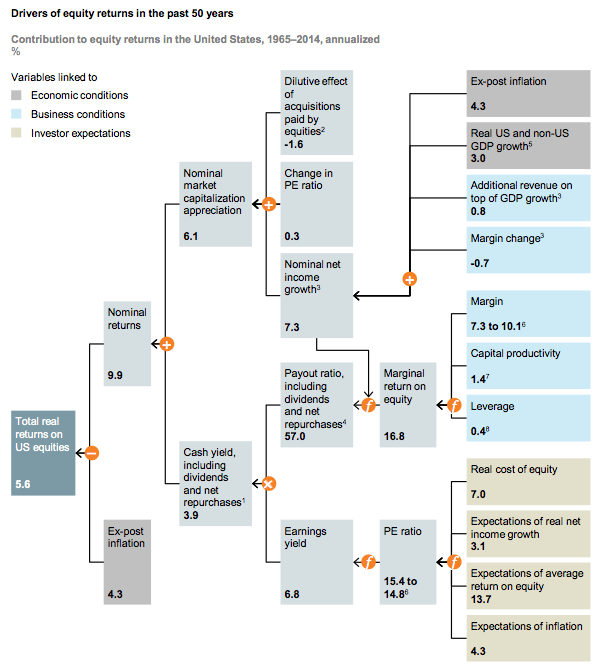 This is from the McKinsey report I referenced yesterday — I have to take a closer look at it, as it strikes me as an odd structure...
Read More
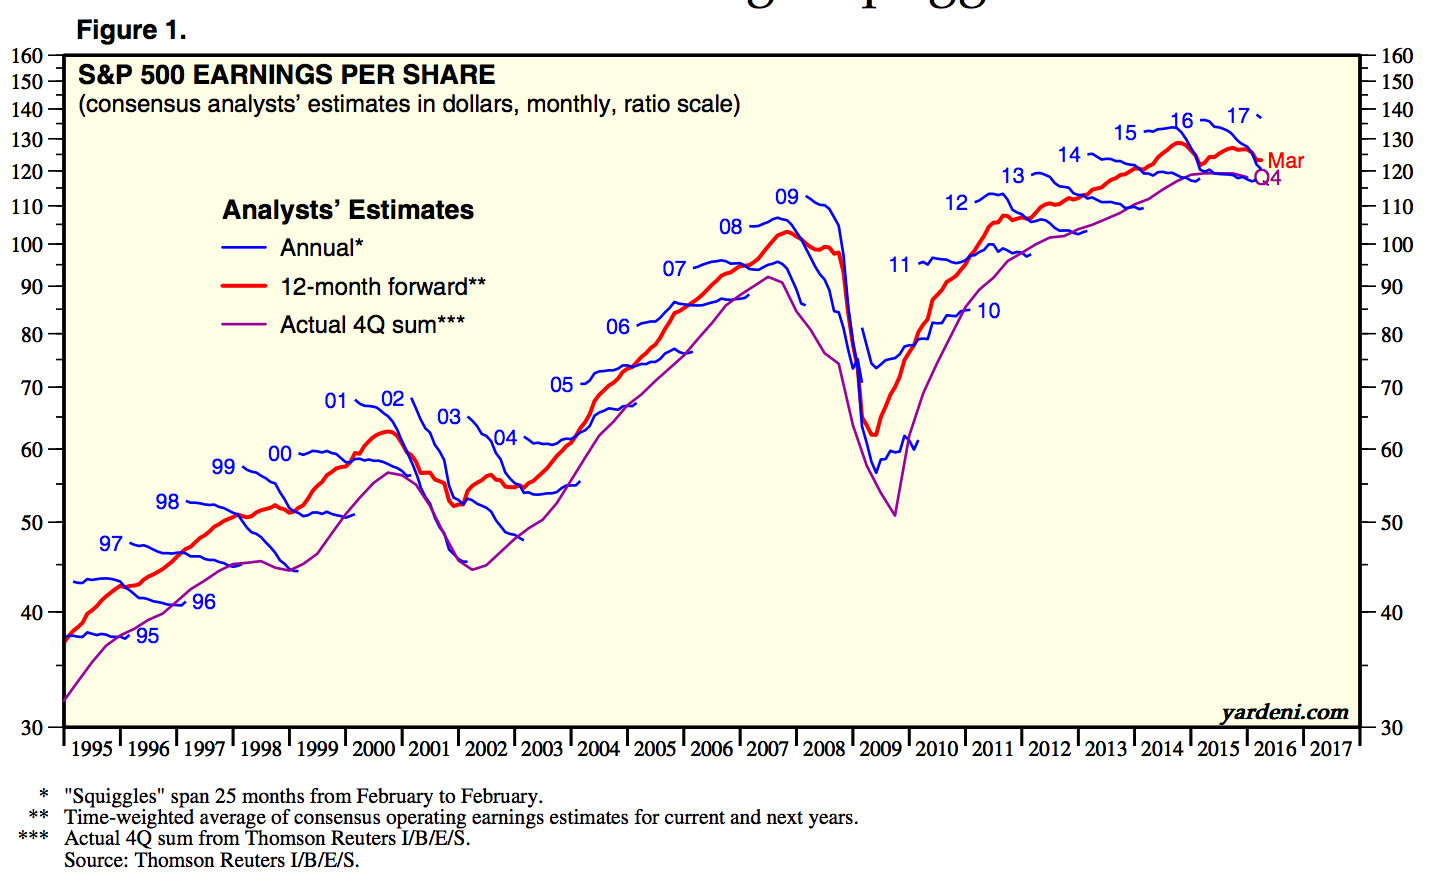 Fascinating look at the tendency for analysts to overestimate earnings, except at market lows, when they under-estimate them: ...
Read More
 One of the big concerns for investors is the health of corporate profits, which have declined in the three of the past four...
Read More