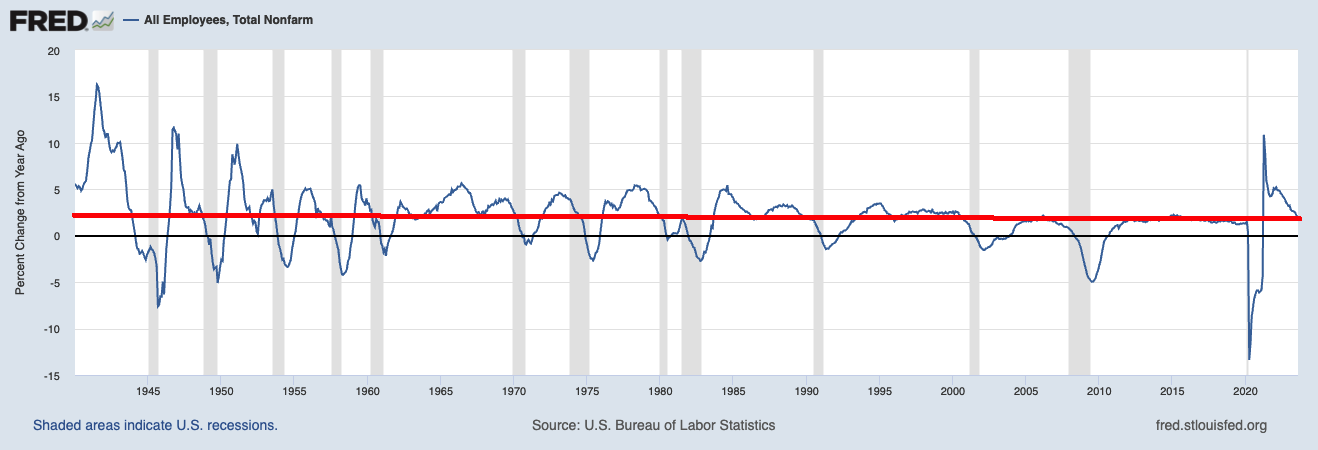
 You may have missed the most important data point in today’s Employment report. It wasn’t that Nonfarm payrolls...
Read More
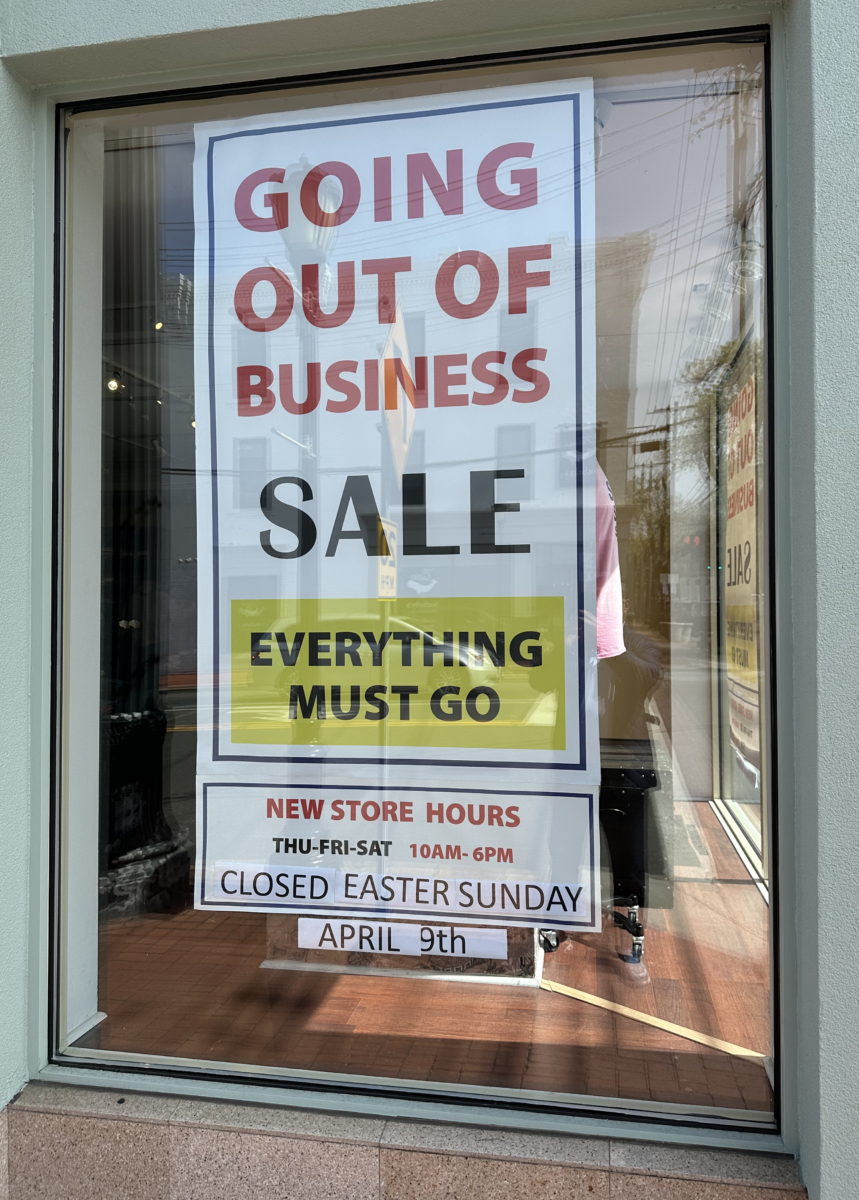
 If ever a week was ripe for delaying your return to the office, it was this one. Hurricane Idalia cleared out the weather...
Read More
 The Fed is done. It’s unimaginable that they will do anything at the September FOMC meeting, and barring any radical change...
Read More
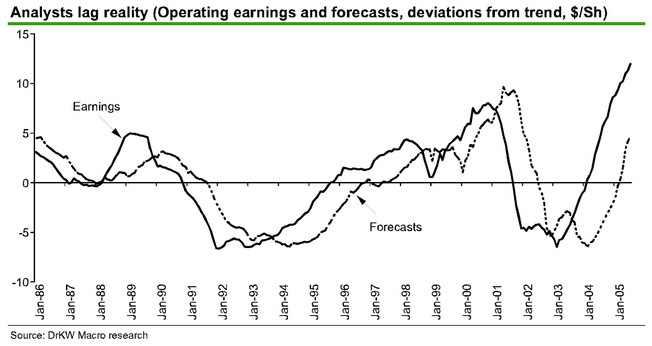 The relevance of perspective to investing is self-evident. When confronted by a problem or challenge, it is useful to change your...
Read More
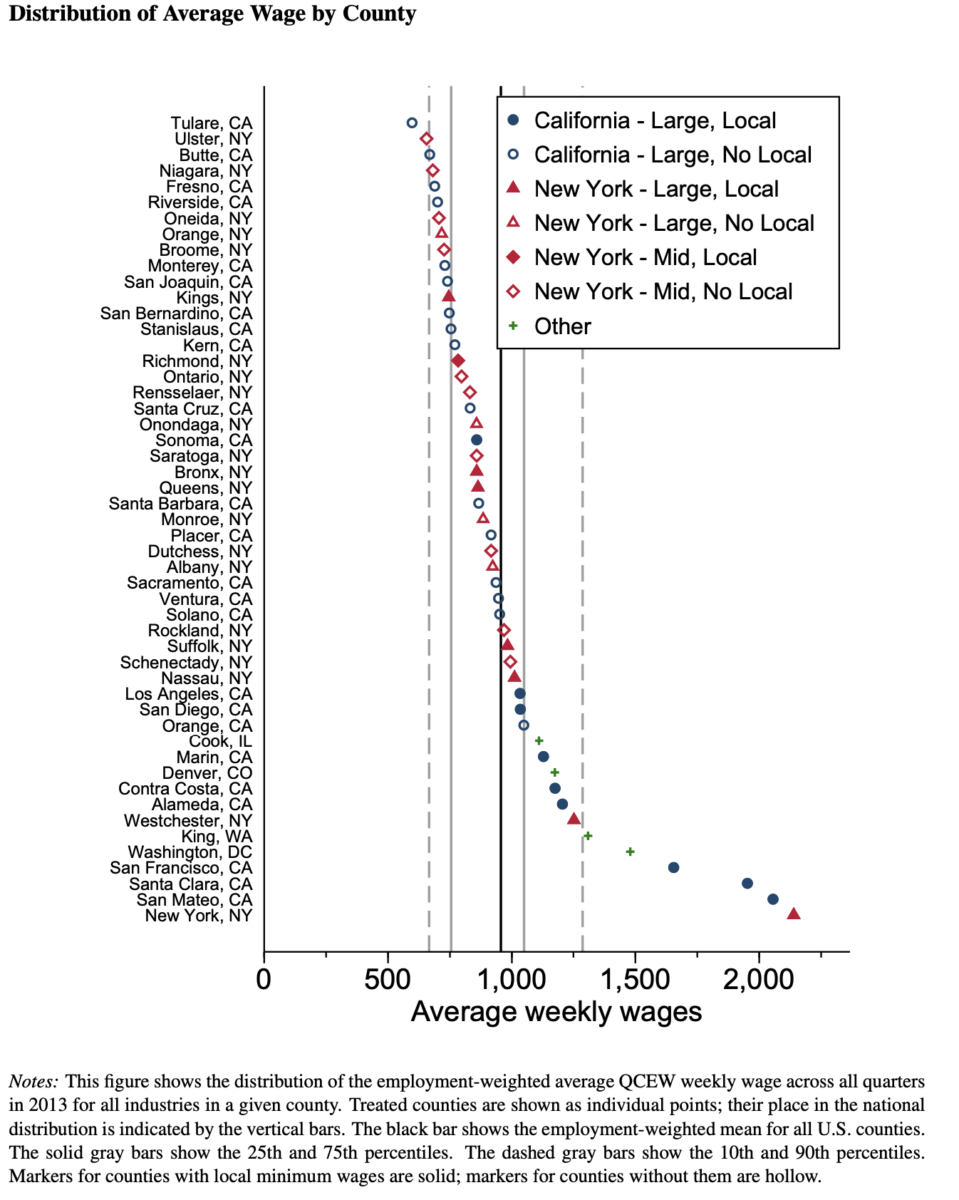 I have been writing about issues with the minimum wage for (it seems like) decades. During that time, consuming lots of academic...
Read More
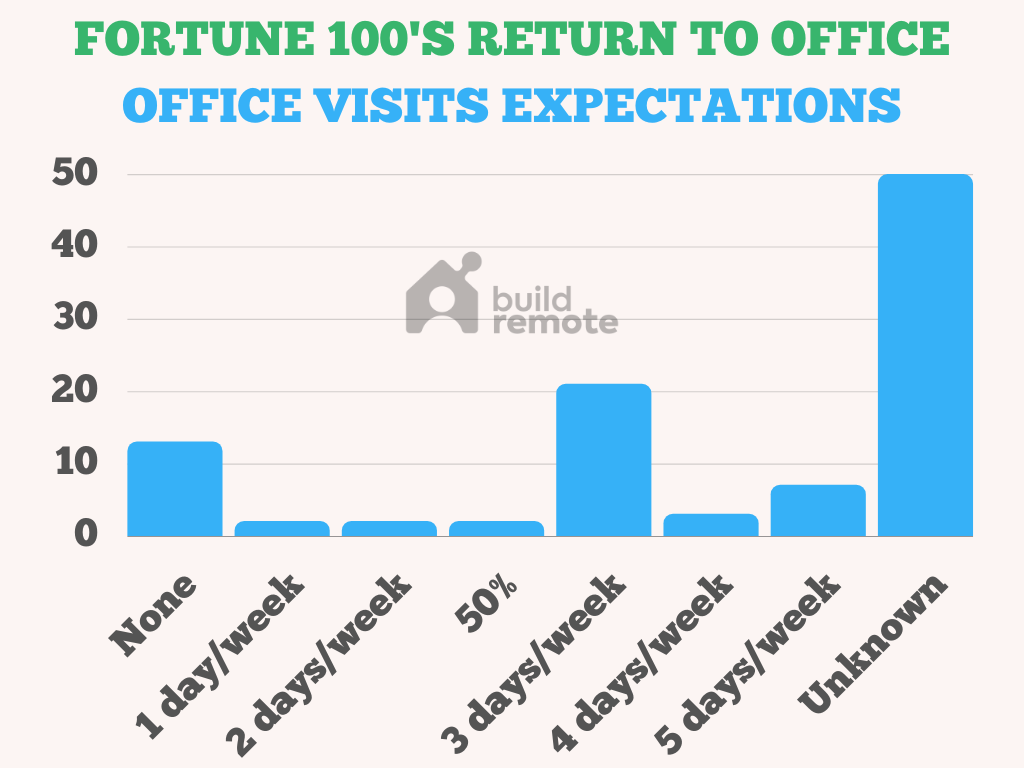
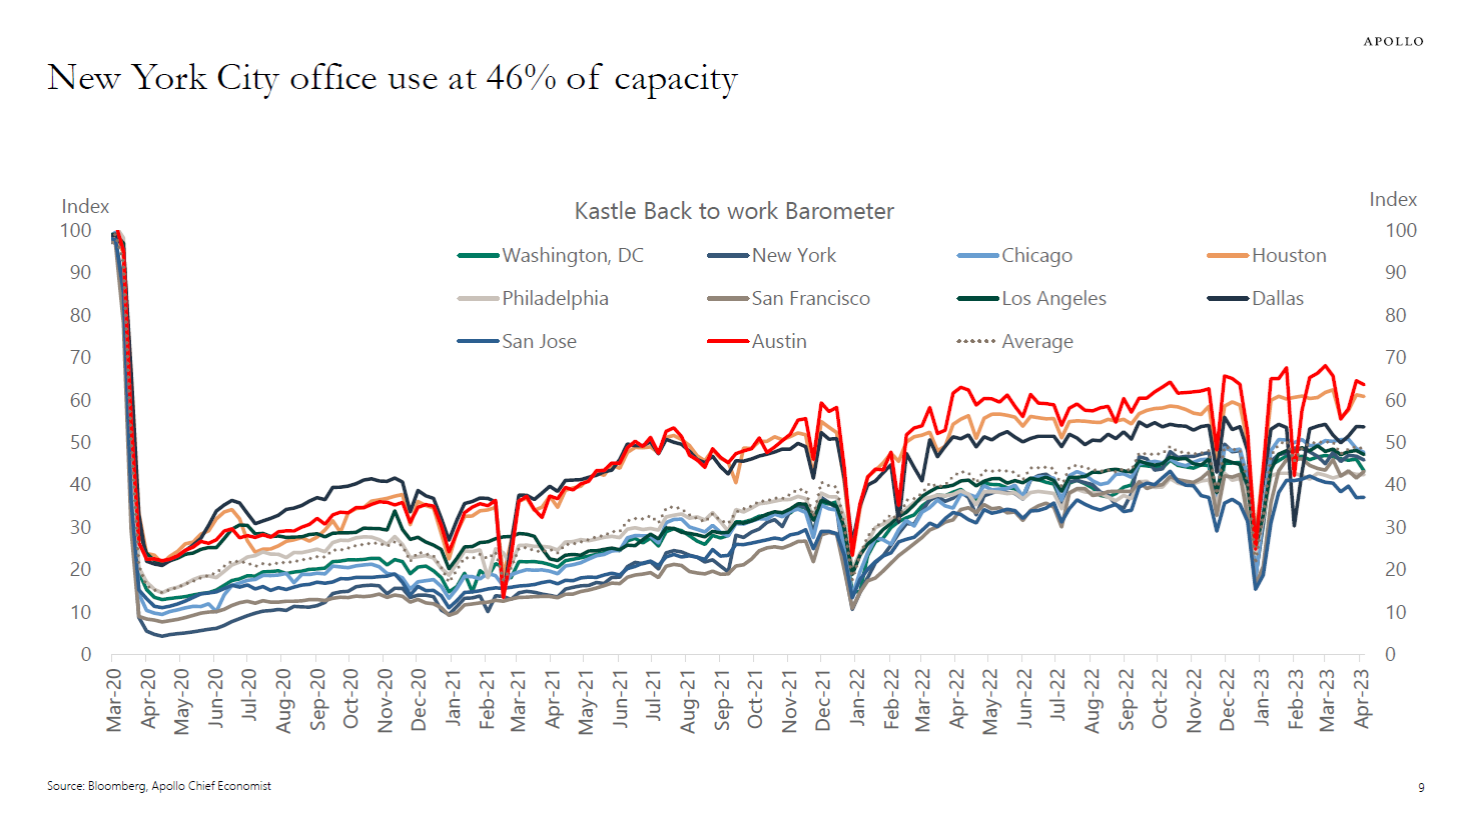 I mentioned a few weeks ago how much better Europe‘s return to office rate was doing versus ours: 90+% RTO, while the USA is...
Read More
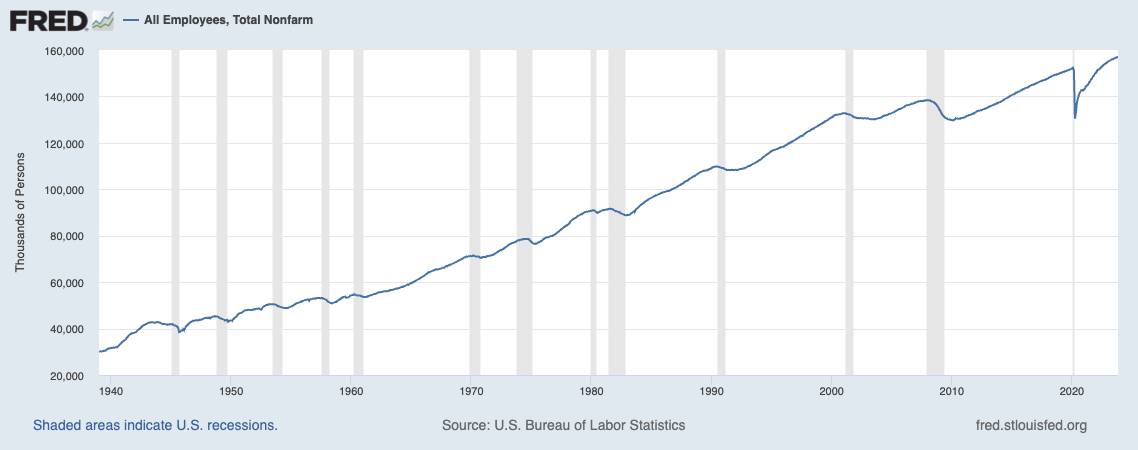
 Nonfarm payrolls came out Friday, and once again they impressed with their underlying strength: 236,000 new workers were added in...
Read More
 Normally, I am a fan of Steve Rattner’s work. The former Obama “Car Czar” makes great charts and seems to be a...
Read More
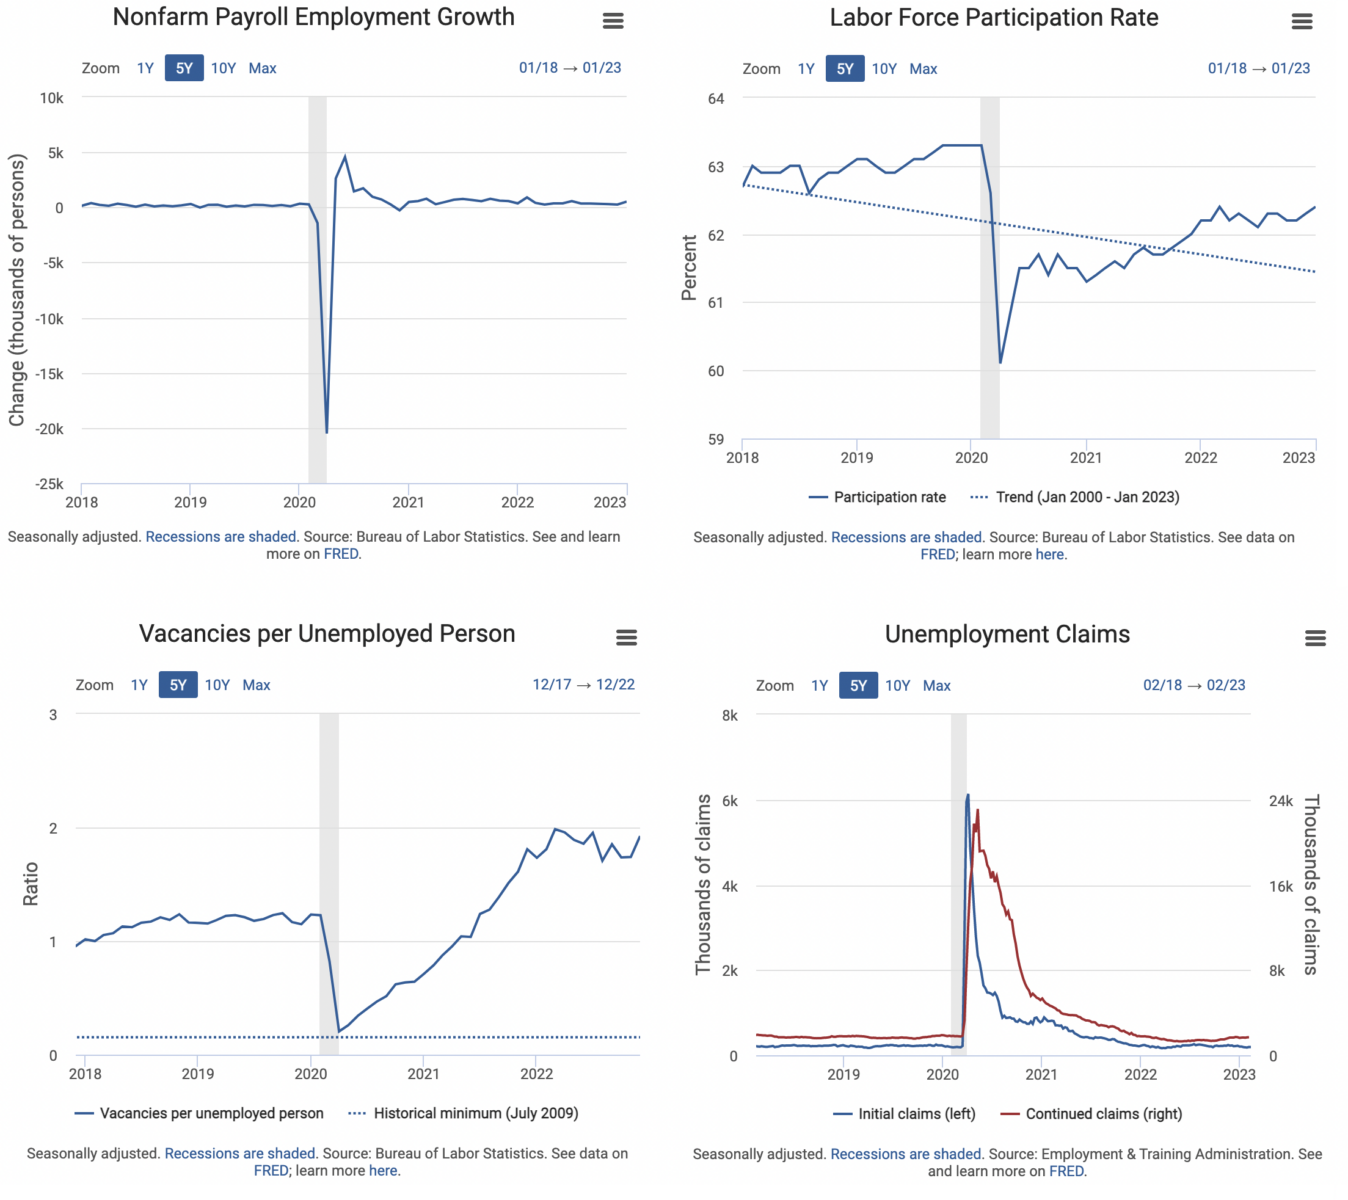 Very useful dashboard via the St. Louis Fed, which maintains the fabulous FRED database. With a clean and simple interface, it puts all...
Read More
 Do you want to continue working from home? Is it past time to return to the office? How much collaboration can you do remotely?...
Read More
