 “Those who know it best love it least for they have been disappointed the most.” -Don Coxe 1 One of the more...
Read More
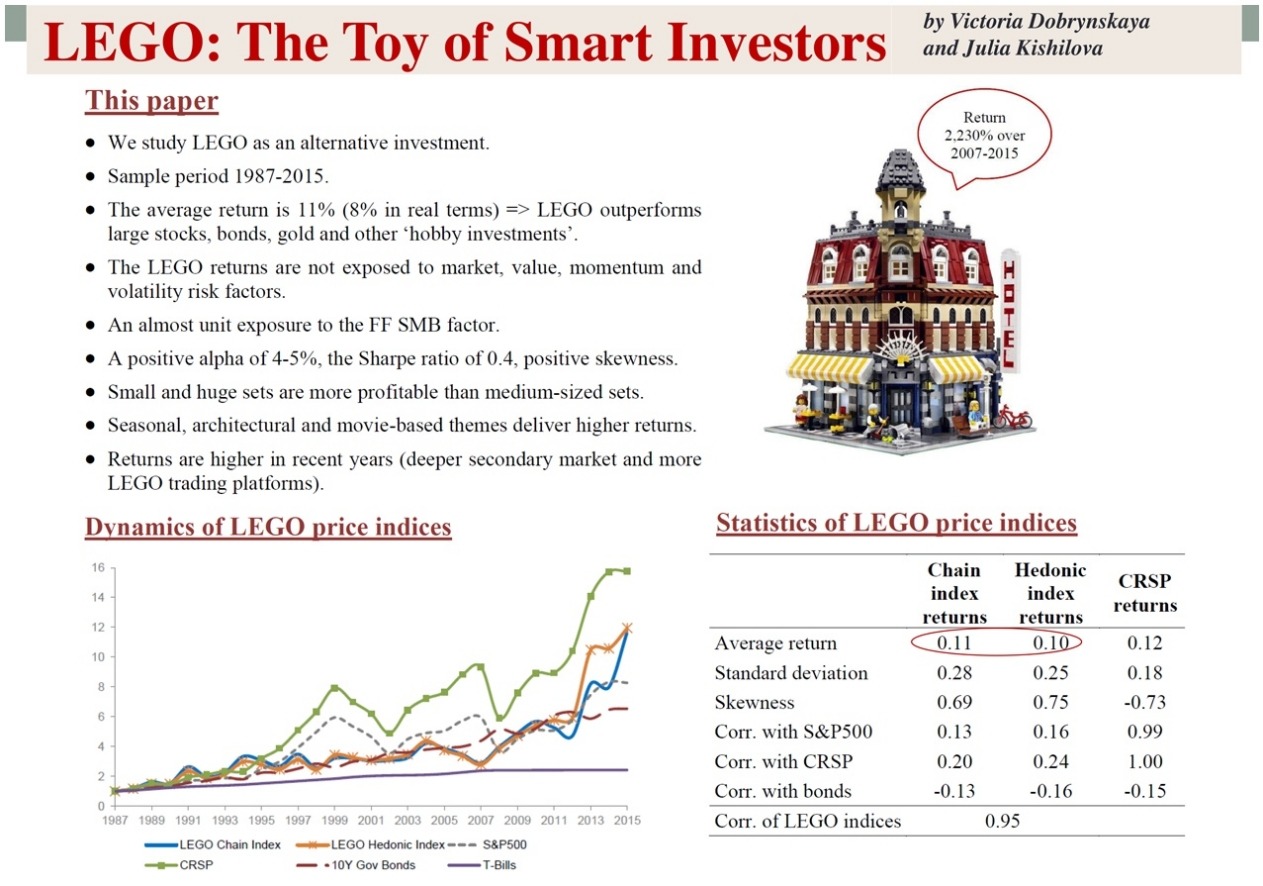 To hear an audio spoken word version of this post, click here. “Study: Toys Prove to Be Better Investment Than Gold,...
Read More
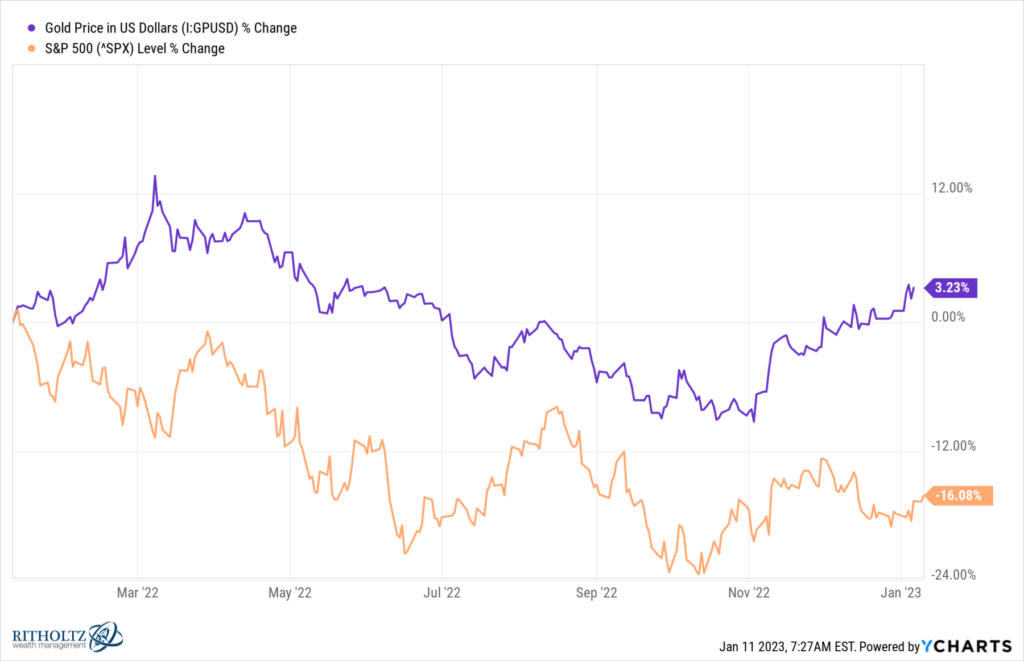
 A friend accidentally sent me an invite to a metals and mining conference. She knows I was bullish on Gold in the mid-2000s...
Read More
The pandemic has changed the state of the economy, and with it, the most attractive risk assets. David Rosenberg expects rates to remain...
Read More
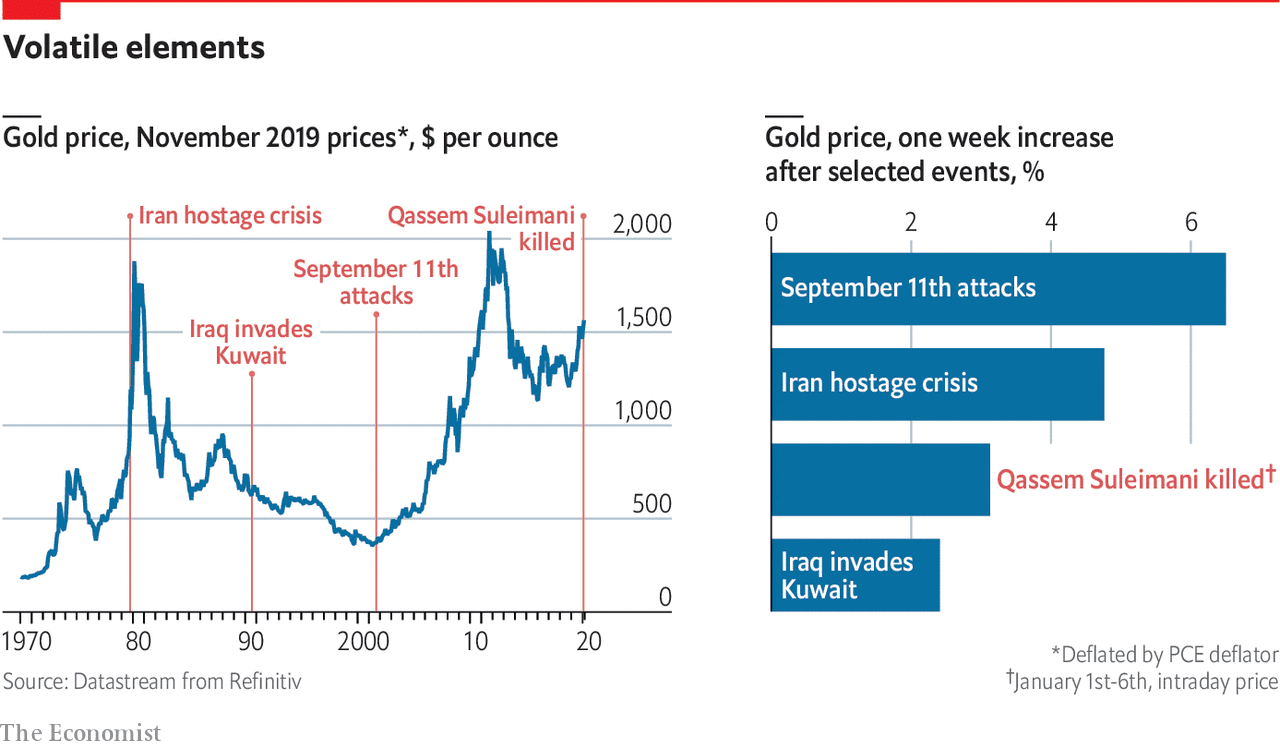 Source: The Economist Gold has been on a tear all of 2019, but the surprise assassination of Iran’s Military leader...
Read More
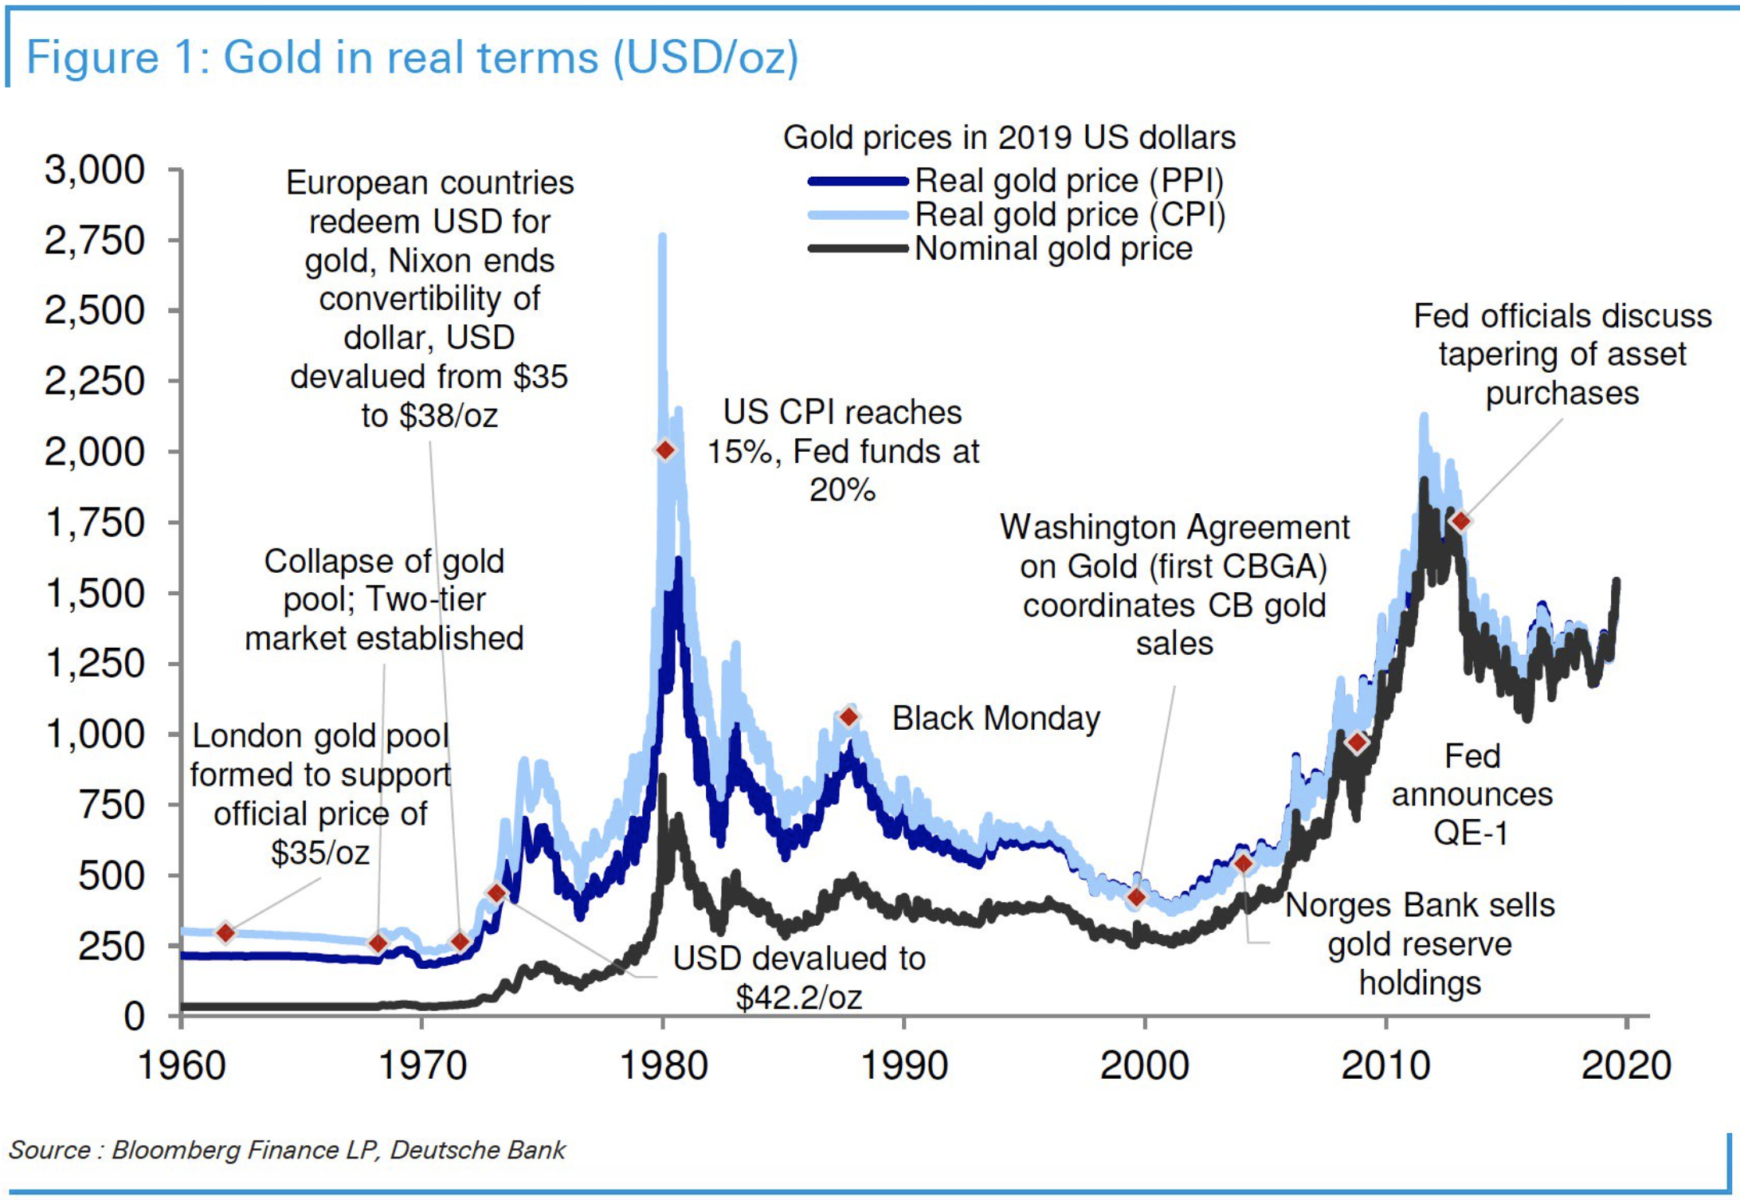 Chart of the Day Gold in Real Terms As Gold rallied past $1500, I wanted to find some historical context. The fascinating...
Read More
A Billionaire Makes a Classic Investing Error Concentrating in a single asset class can be an invitation to trouble. Bloomberg, May 3,...
Read More
This is fascinating: >> Source: Bloomberg More on the topic later today . . .
Read More
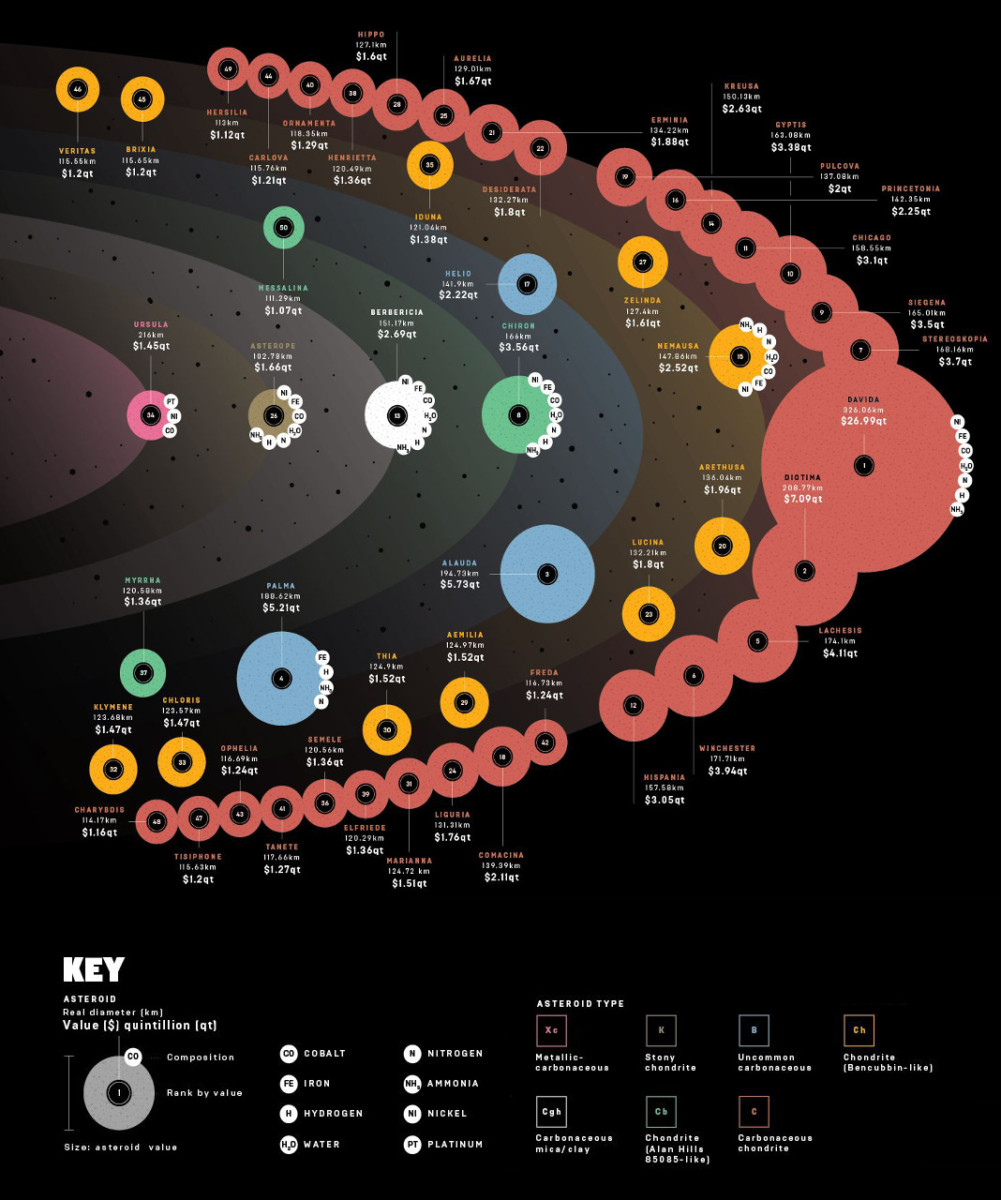 Very cool: click for ginormous graphic Source: Visual Capitalist
Read More
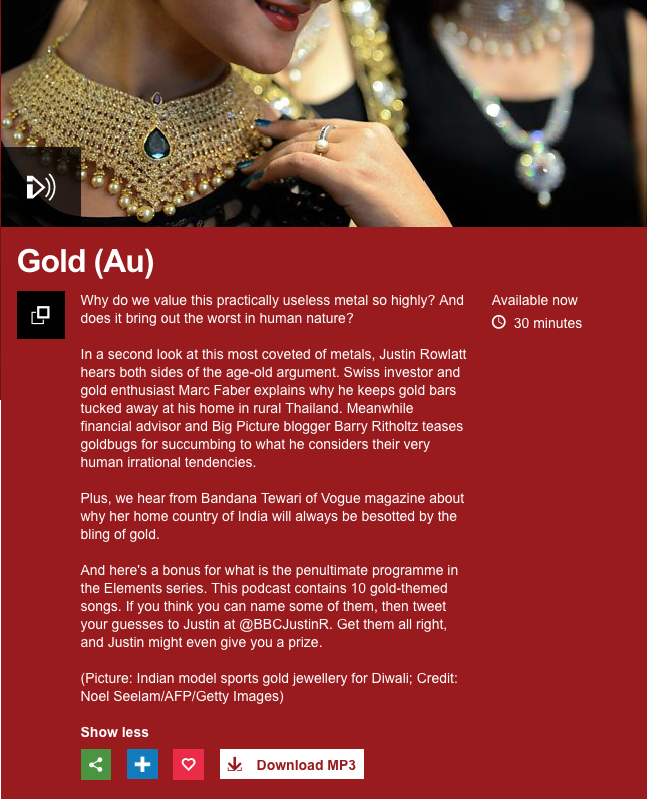 I had some fun doing the BBC podcast Elements — a series on all of the elements in the periodical table; my segment...
Read More
