Transcript: Mark Wiedman, Blackrock’s Head of Global...
The transcript from this week’s, MiB: Mark Wiedman, Blackrock’s Head of Global Client Business, is below. You can...

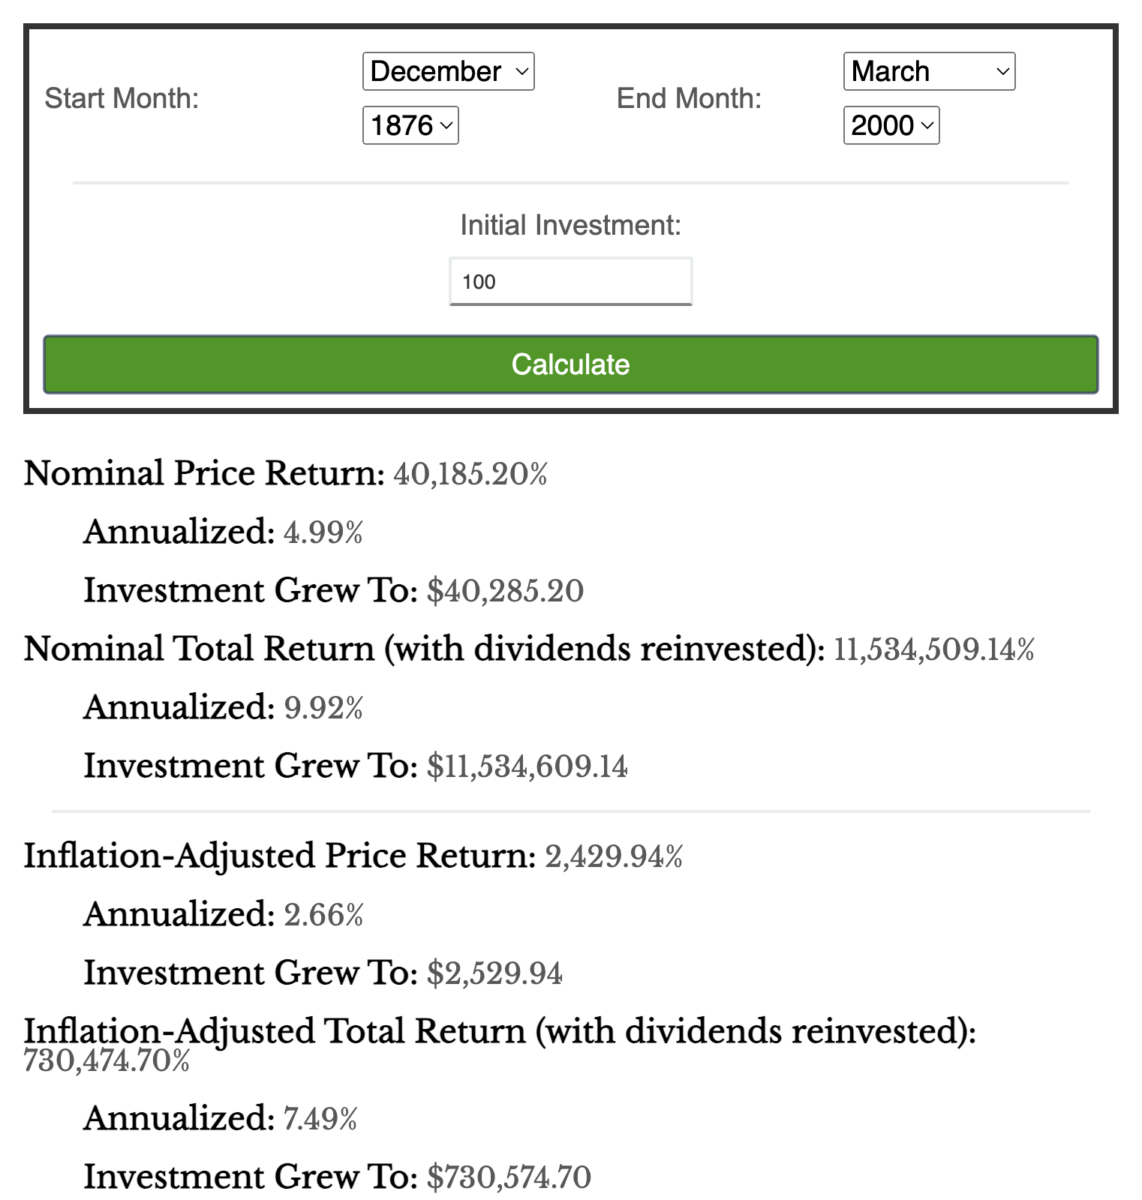 I have been playing with Nick’s S&P 500 calculator, and it’s pretty damned, cool. He used data from Robert...
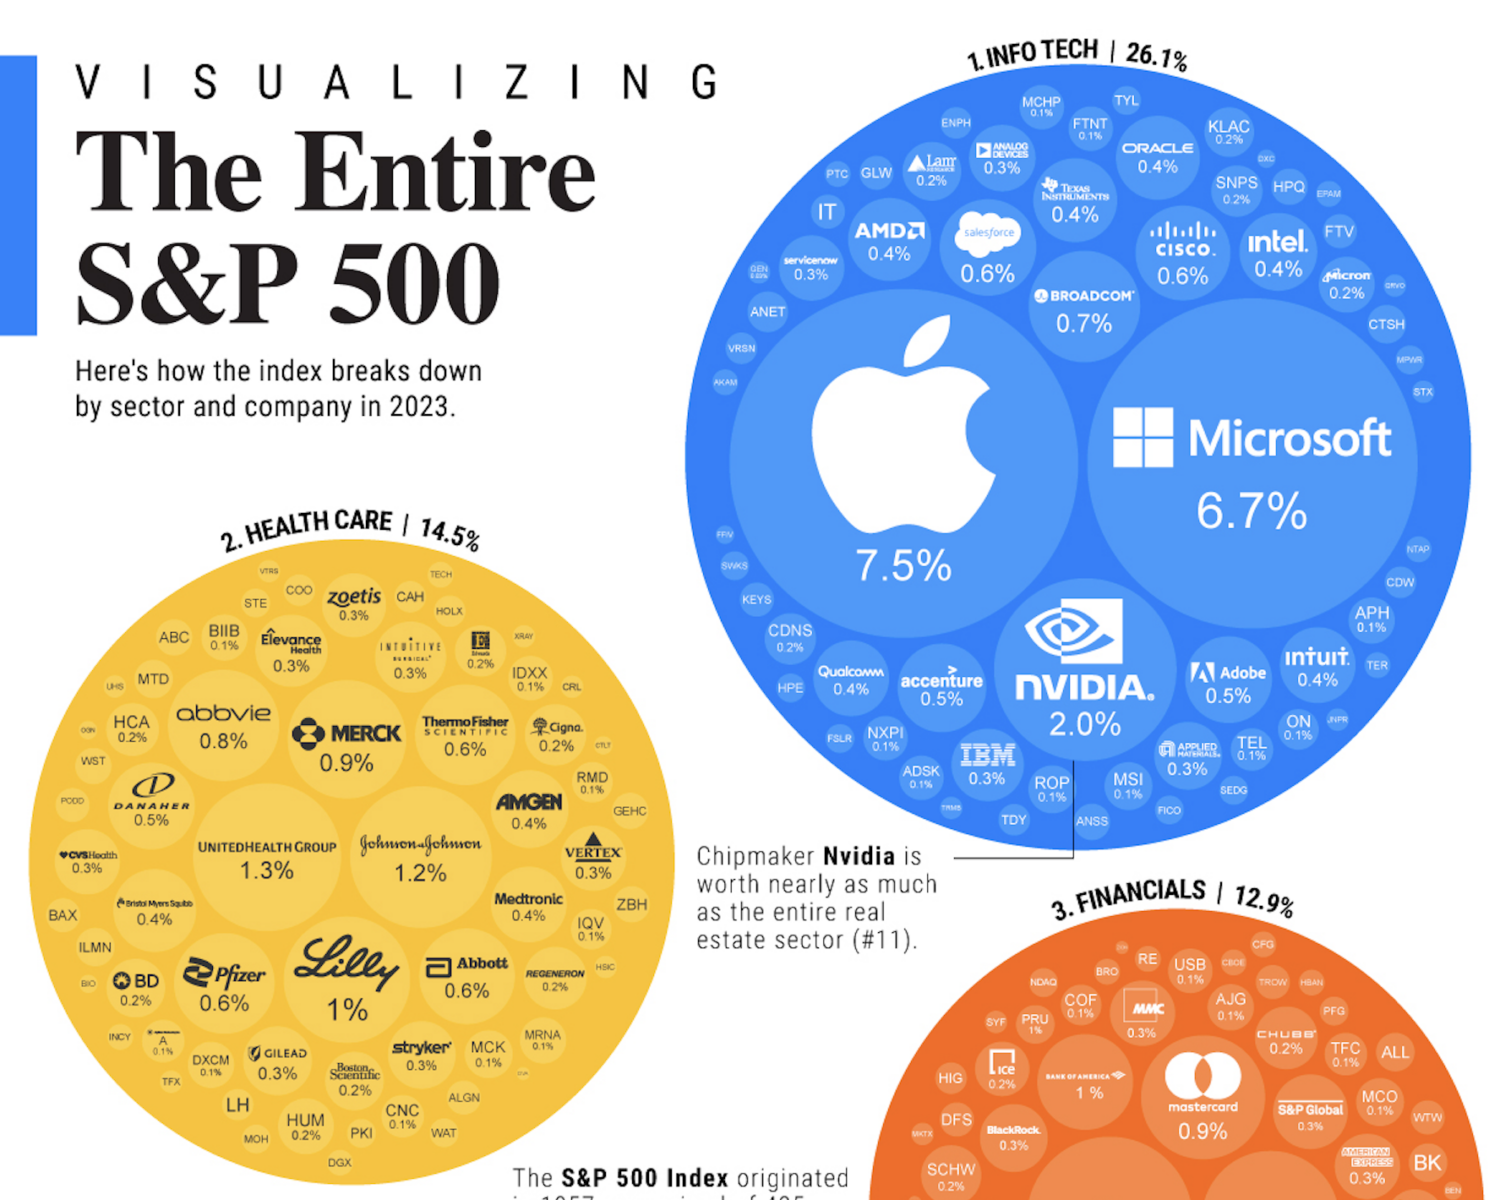 All of the companies in the S&P 500 are worth $7.1 trillion in assets, accounting for close to 80% of available market...
 “It is difficult to get a man to understand something when his salary depends upon his not understanding...
 In the never-ending battle of market narratives, new ideas get introduced and old ideas are resurrected as necessary. One...
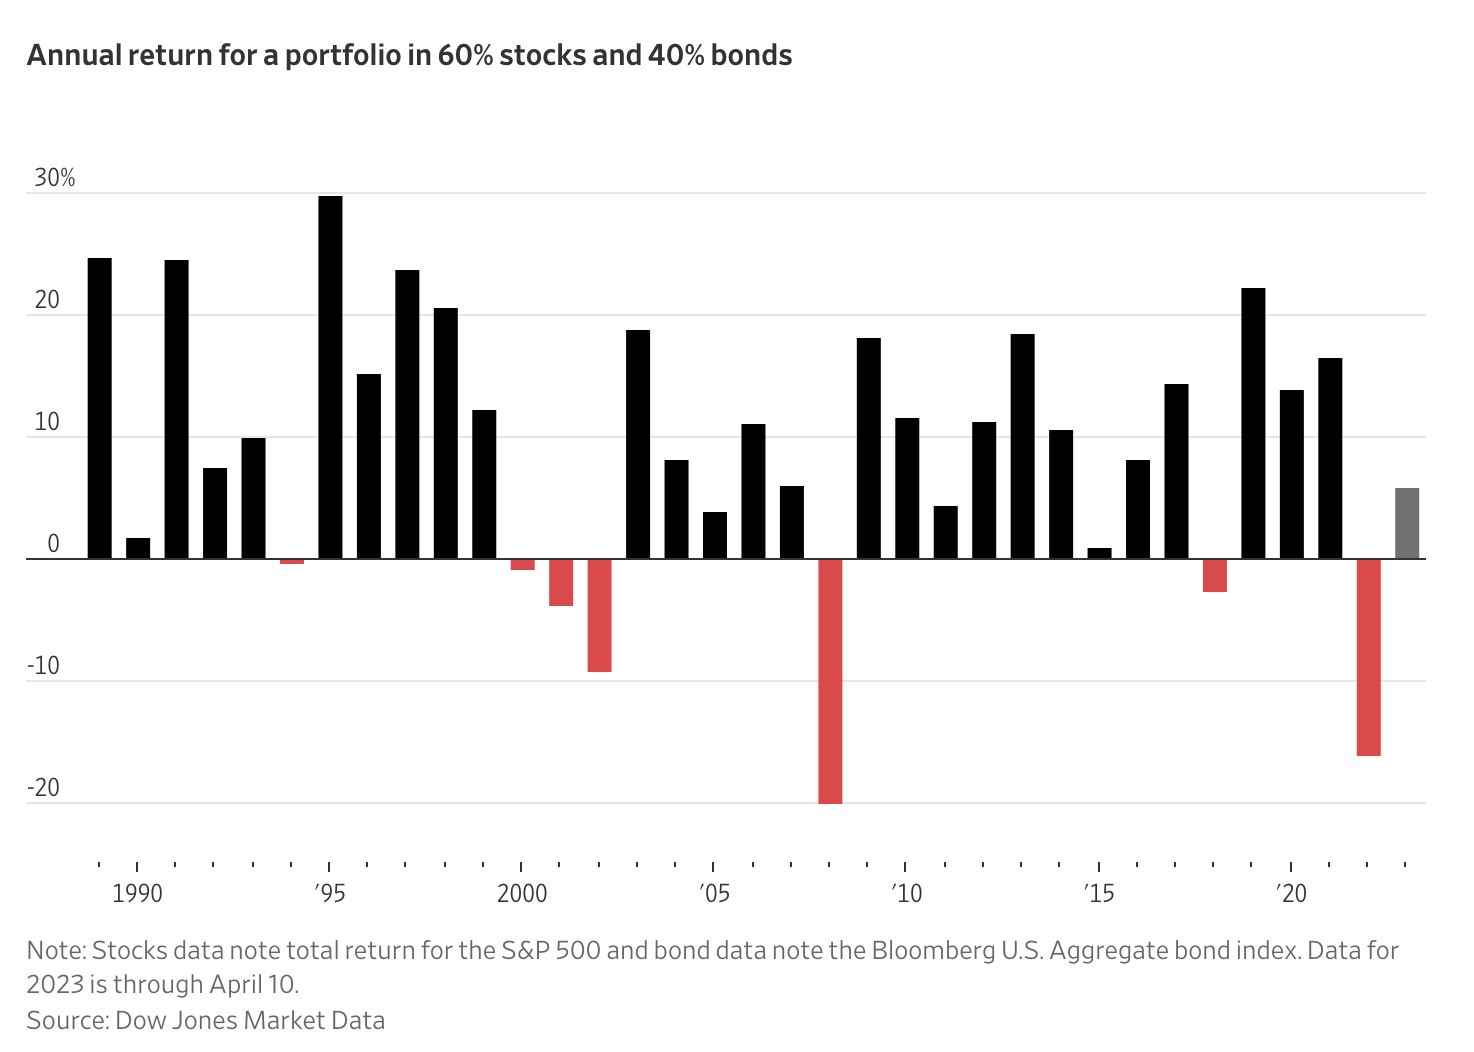 Check out these recent headlines about the classic 60/40 investment strategy1: The 60-40 Investment Strategy Is Back After Tanking...
Get subscriber-only insights and news delivered by Barry every two weeks.