MIT Sloan Investment Conference 2024
 Hey, I am heading up to Boston today for the annual MIT Sloan Investment Conference. Its’ always a fascinating time (I...
Transcript: Sarah Kirshbaum Levy, CEO Betterment
The transcript from this week’s, MiB: Sarah Kirshbaum Levy, CEO Betterment, is below. You can stream and download our...
MiB: Sarah Kirshbaum Levy, CEO Betterment
This week, we speak with Sarah Kirshbaum Levy, chief executive officer of Betterment, an independent digital investment...
What Does the Misery Index Say About the 2024 Election?
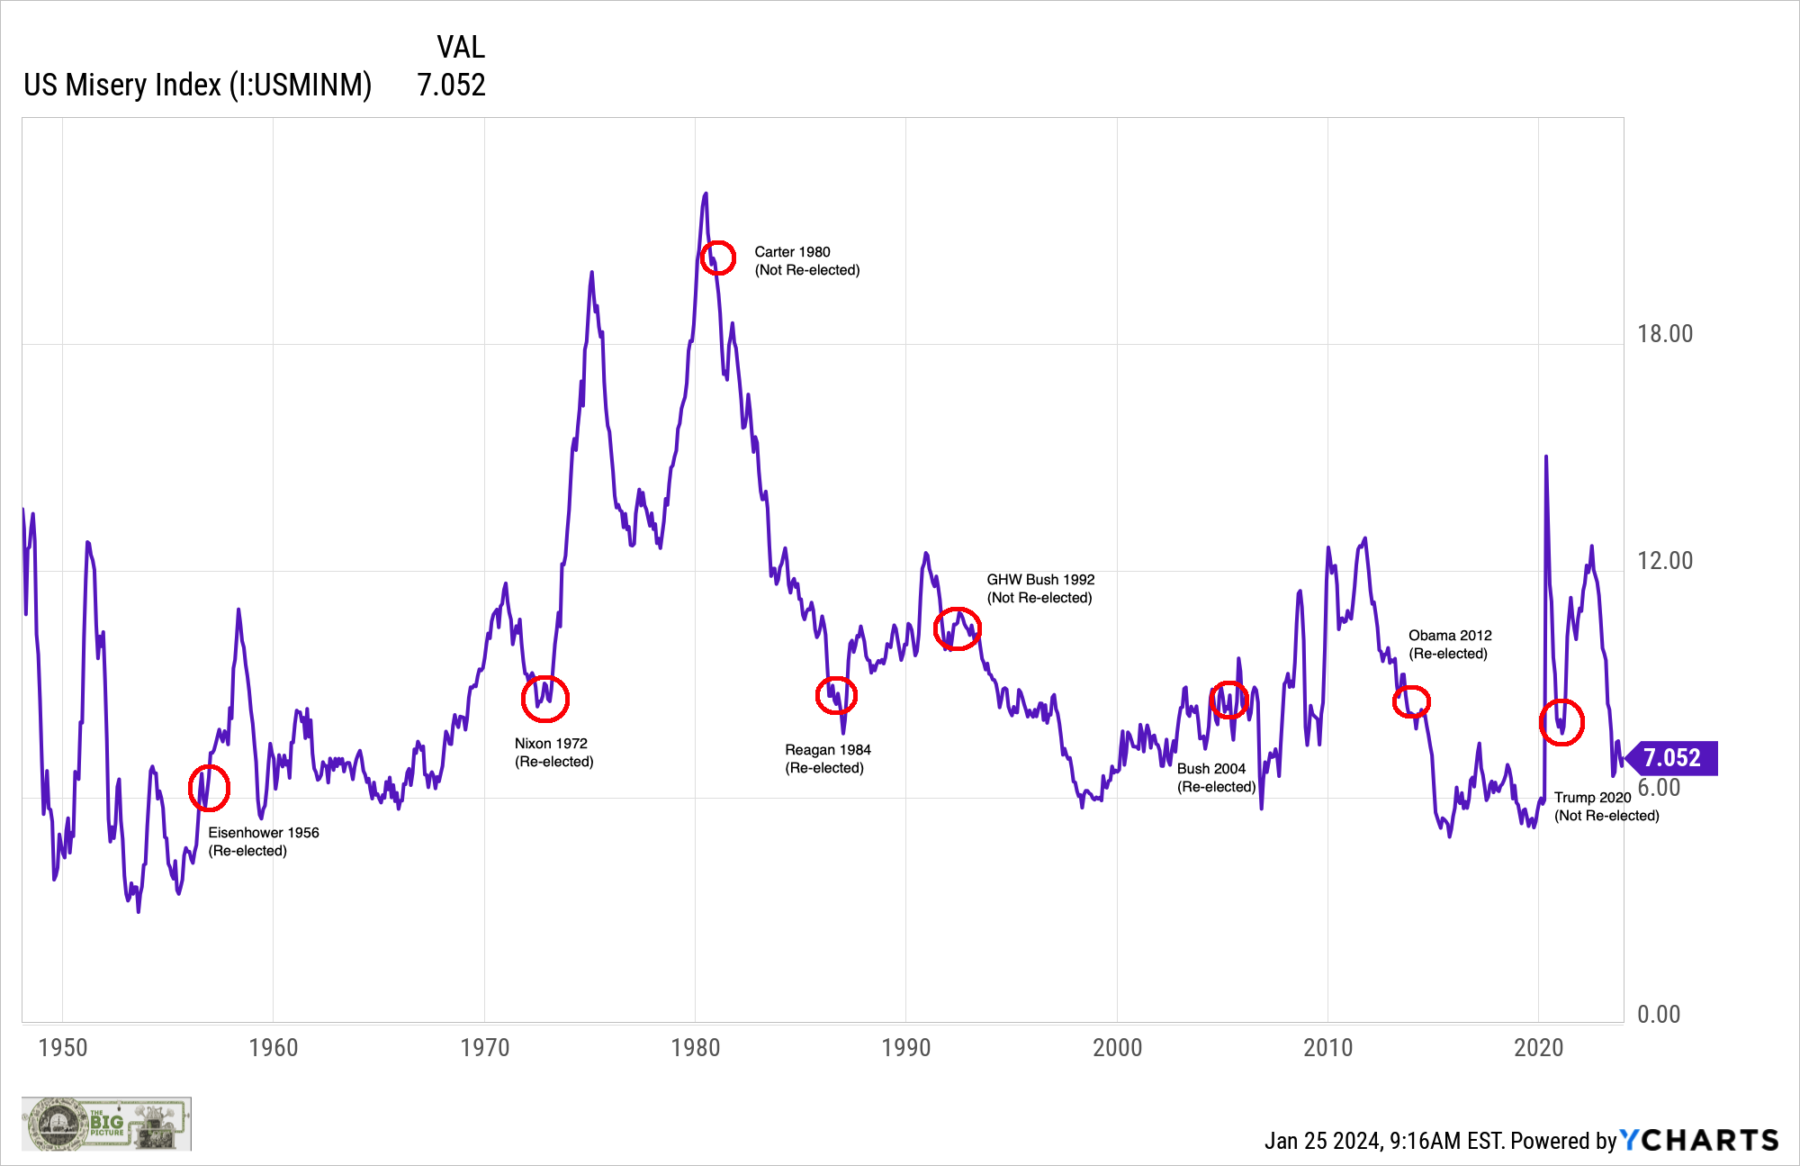 The endless media Sturm und drang over the 2024 election silly season has led me to share a few thoughts and a chart. I...
MiB: Jenny Johnson, Franklin Templeton CEO
For our final show of the year, we are rebroadcasting a team favorite — our special 500th episode of...
At the Money: Seasonality In Stocks
At the Money: Seasonality In Stocks with Jeff Hirsch of the Stock Trader’s Almanac. (Dec 20, 2023) How do...
Transcript: Joel Tillinghast, Fidelity
The transcript from this week’s, MiB: Joel Tillinghast, Fidelity’s Legendary Fund Manager, is below. You can stream and...
MiB: Joel Tillinghast, Fidelity’s Legendary Fund Manager
This week, we speak with investing legend Joel Tillinghast. He has been a mutual fund manager in the equity division...