Transcript: Fern Mallis Fashion Icon
The transcript from this week’s MIB: Fern Mallis, Fashion Icon, is below. You can stream/download the full conversation,...

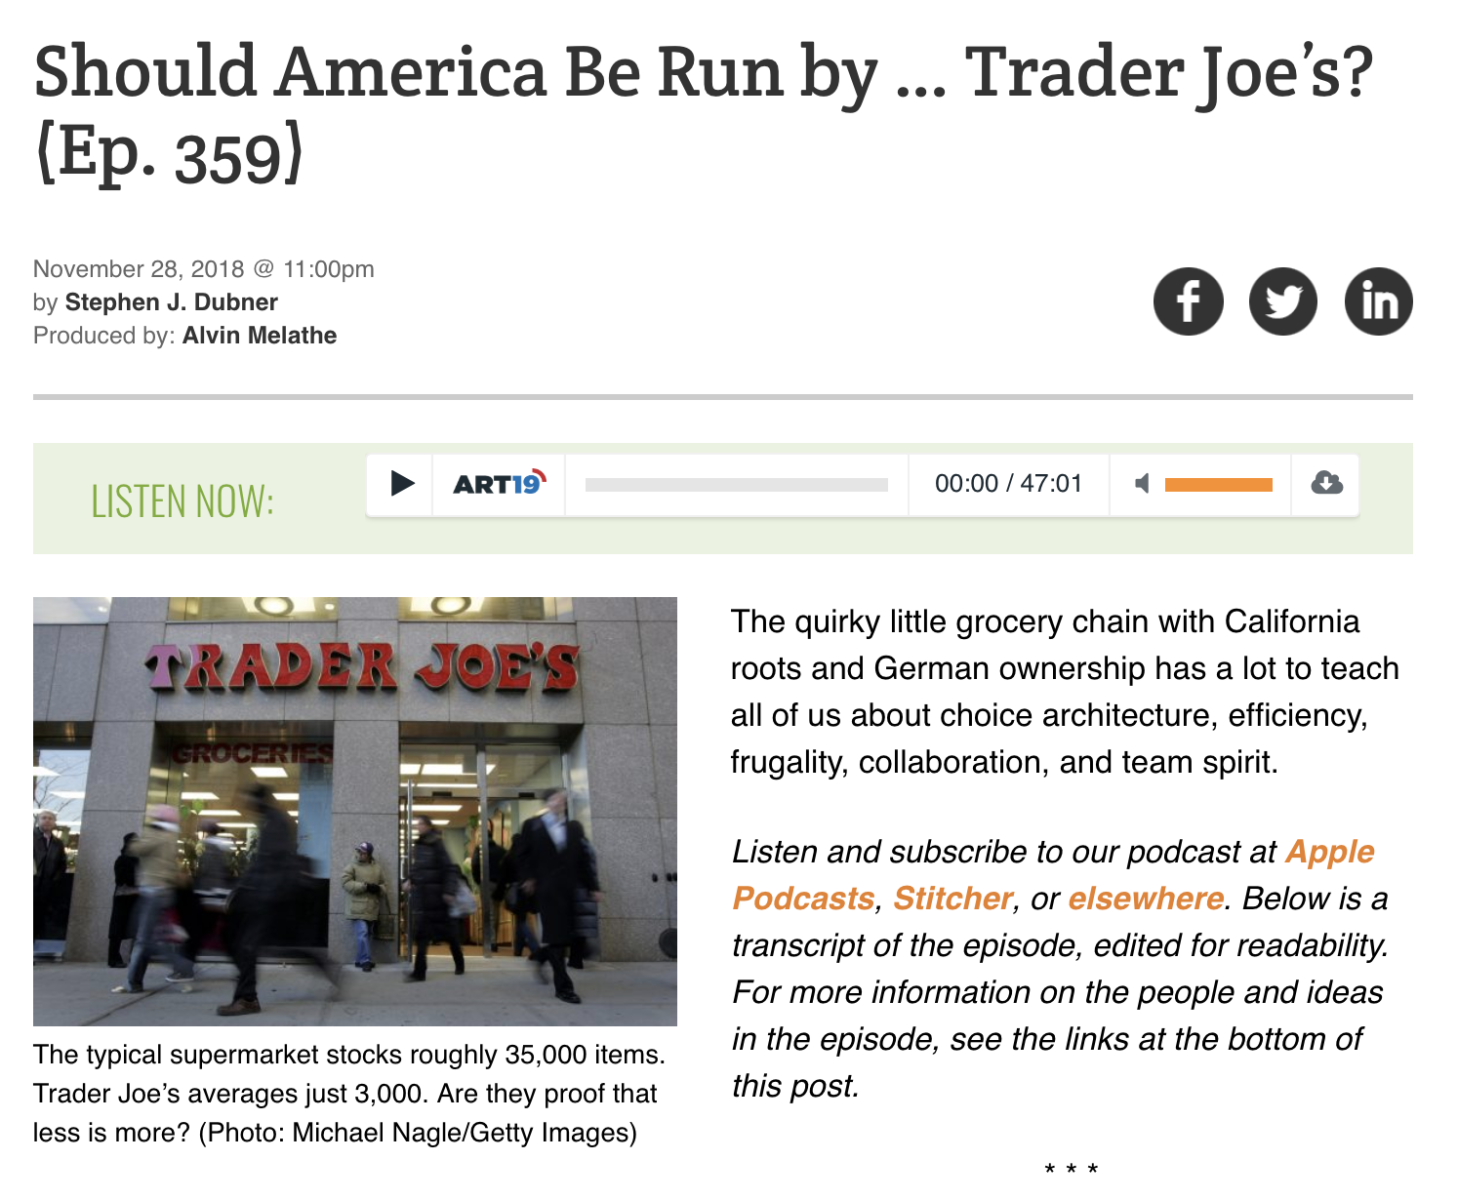 The quirky little grocery chain with California roots and German ownership has a lot to teach all of us about choice architecture,...
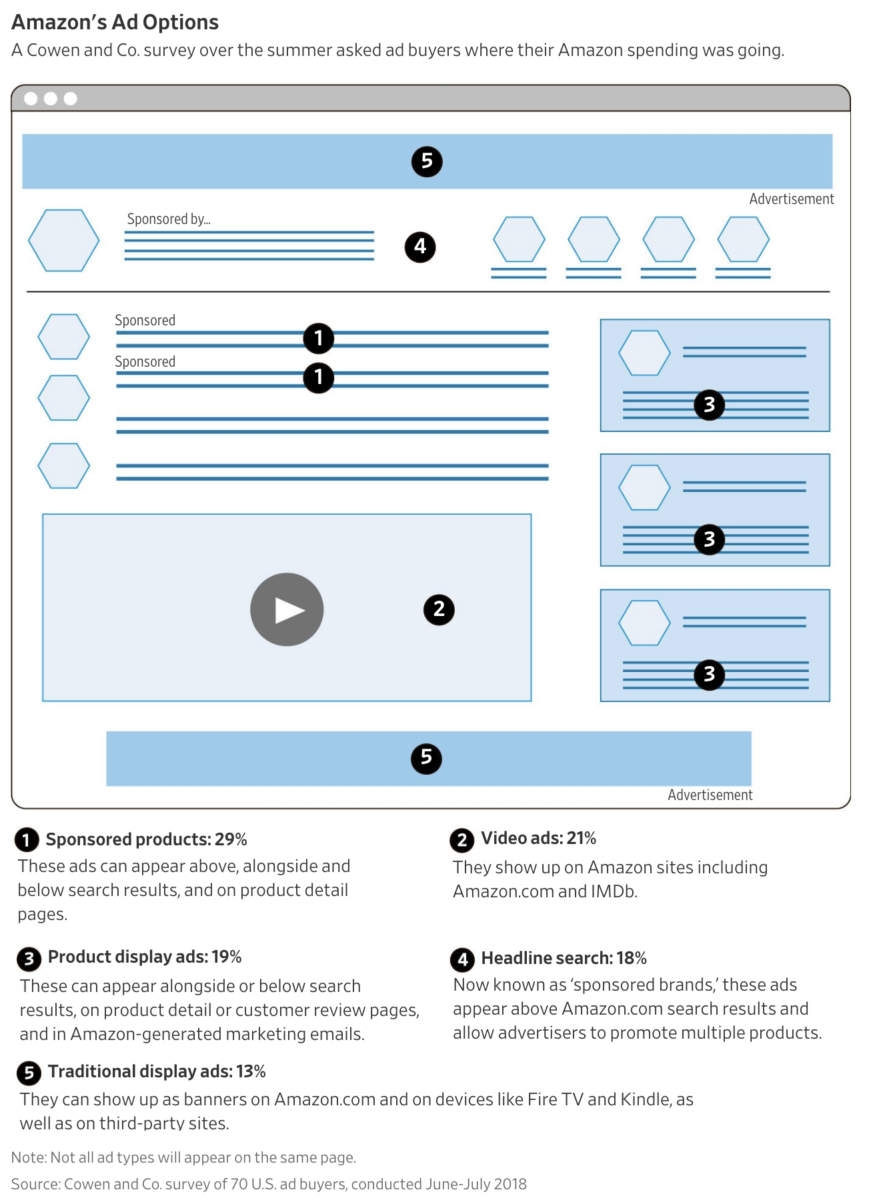 WSJ: “The online retailer has ascended to the No. 3 spot in the U.S. digital ad market behind the dominant...
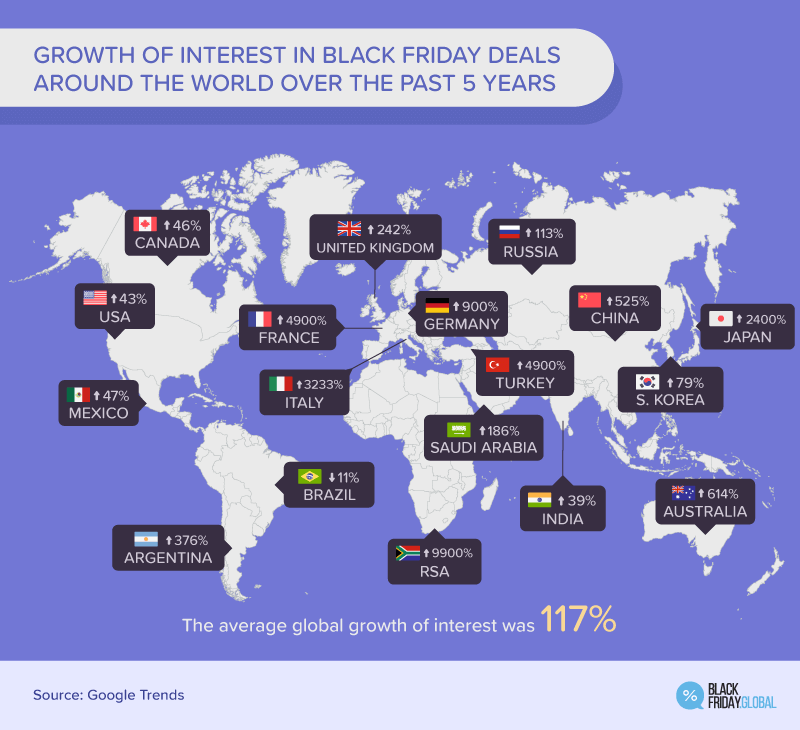 The statistical site Statista has some really interesting charts related to Black Friday: click for ginormous chart
Get subscriber-only insights and news delivered by Barry every two weeks.