At the Money: How to Pay Less Capital Gains Taxes
At the Money: How to Pay Less Capital Gains Taxes (January 24, 2024) We’re coming up on tax season, after a banner...

 Earlier this year, I gave my first presentation since the pandemic began. I discussed all of the many ways we hurt ourselves...
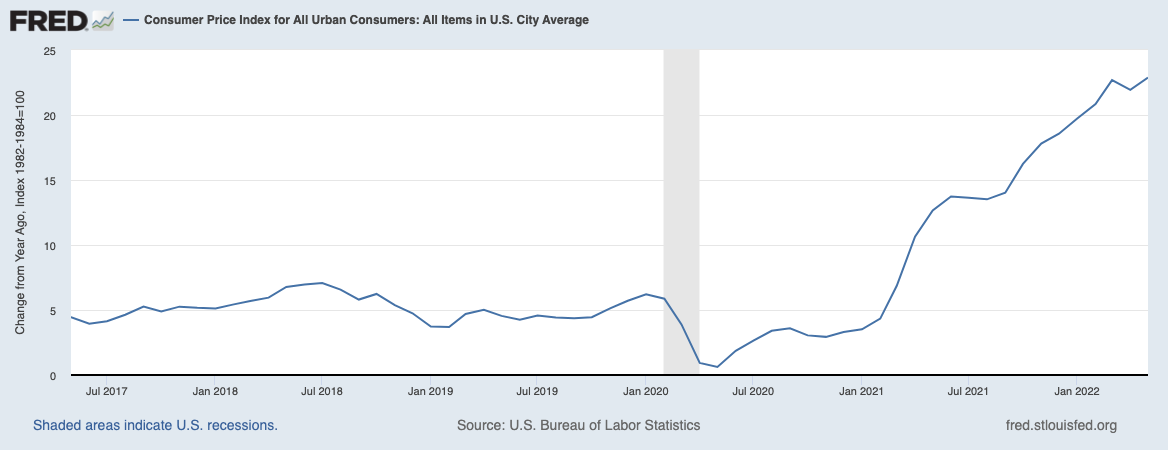 Who is to blame for the rampant inflation the United States (and the entire world) have been experiencing over the past 12...
 Of all the ill-advised, misguided nonsense Congress peddles on a daily basis, I cannot identify any more foolish than their...
 It Took the Democrats Half a Century to Rediscover Trickle-Up Economics While Republicans cling to trickle-down delusions, Biden is...
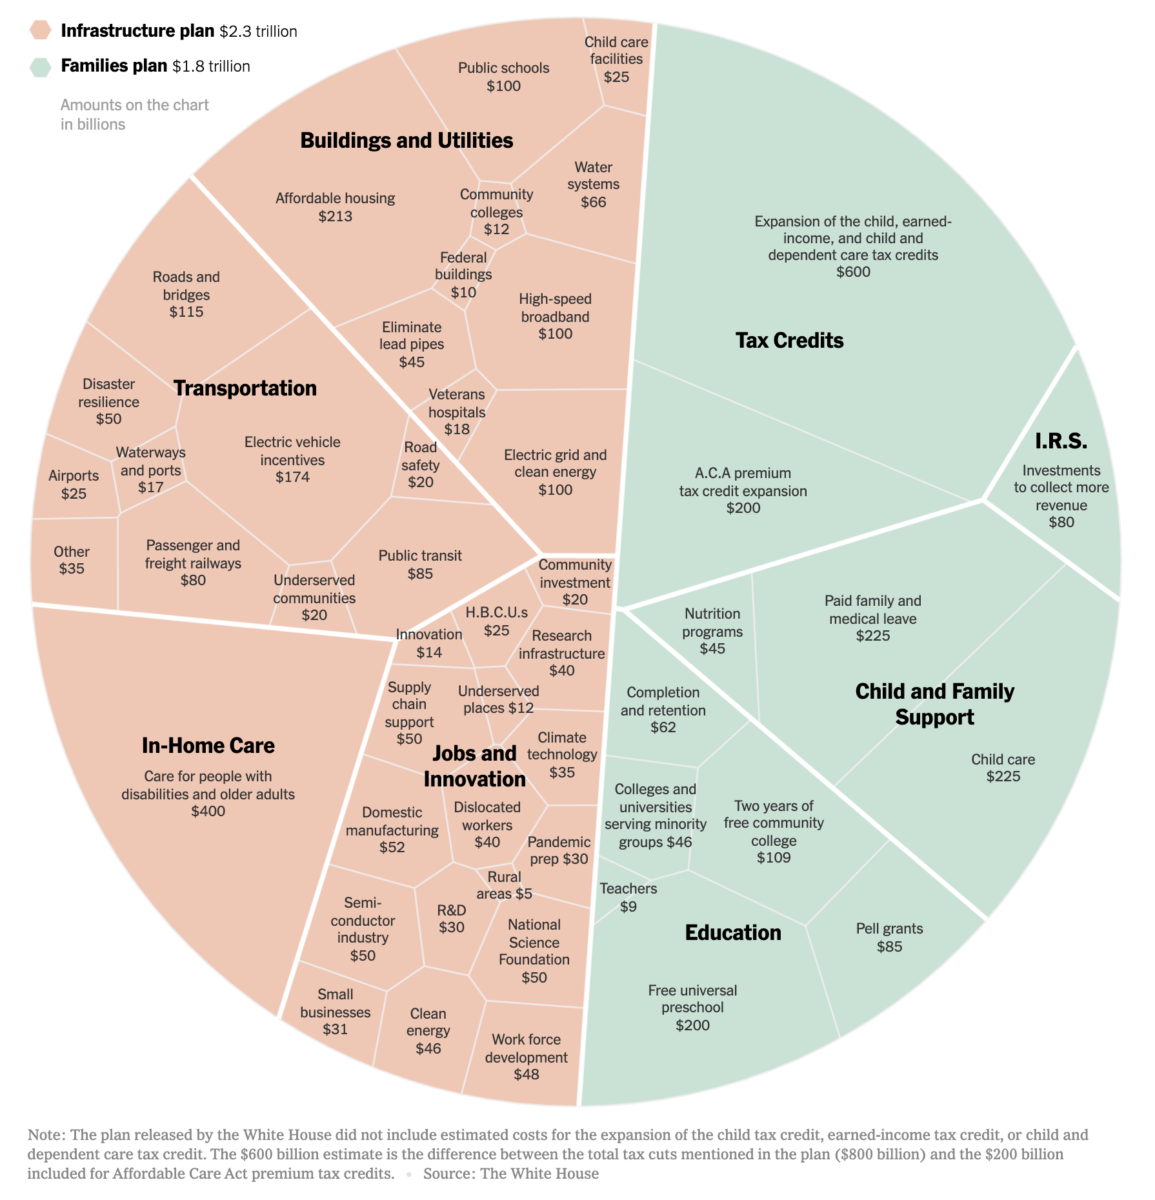 Biden’s $4 Trillion Economic Plan, in One Chart Source: New York Times This is a pretty big deal, and its hard to judge...
Get subscriber-only insights and news delivered by Barry every two weeks.