 If you are anywhere near downtown NYC today, swing by the Convene conference center and check out the annual event. There...
Read More
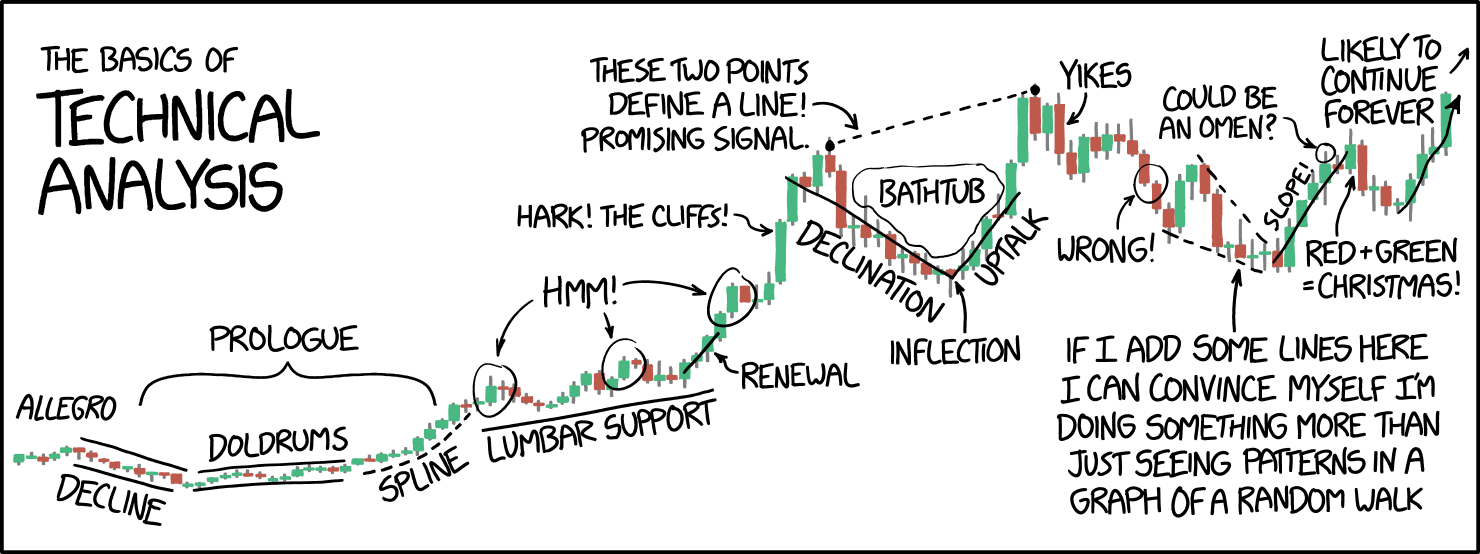 Instant classic: (mouse over for James Tobin Easter egg) Source: xkcd
Read More
Last week, I jumped on the phone with J.C. Parets to discuss behavior and technical analysis on his podcast called Technical...
Read More
I was saddened to learn today that Paul Desmond of Lowry’s Research has passed away. Paul was instrumental in our understanding of...
Read More
Michael Batnick, director of research at Ritholtz Wealth Management, discusses notable trends under the market’s surface with Mike...
Read More
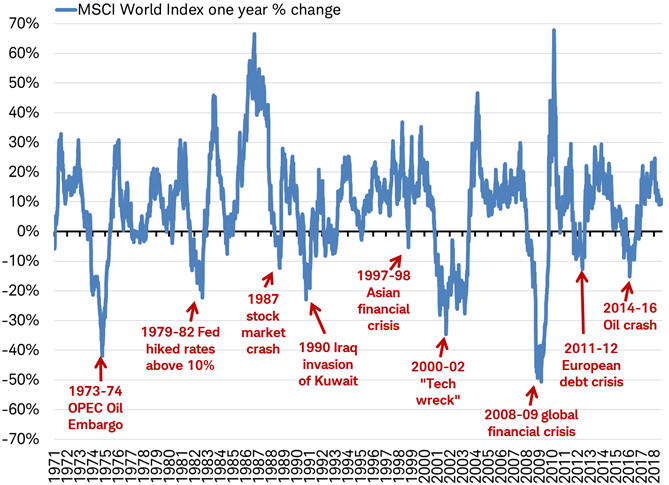 Jeffrey Kleintop, the Chief Global Investment Strategist at Schwab, created this wonderful chart (below) showing the various sources of...
Read More
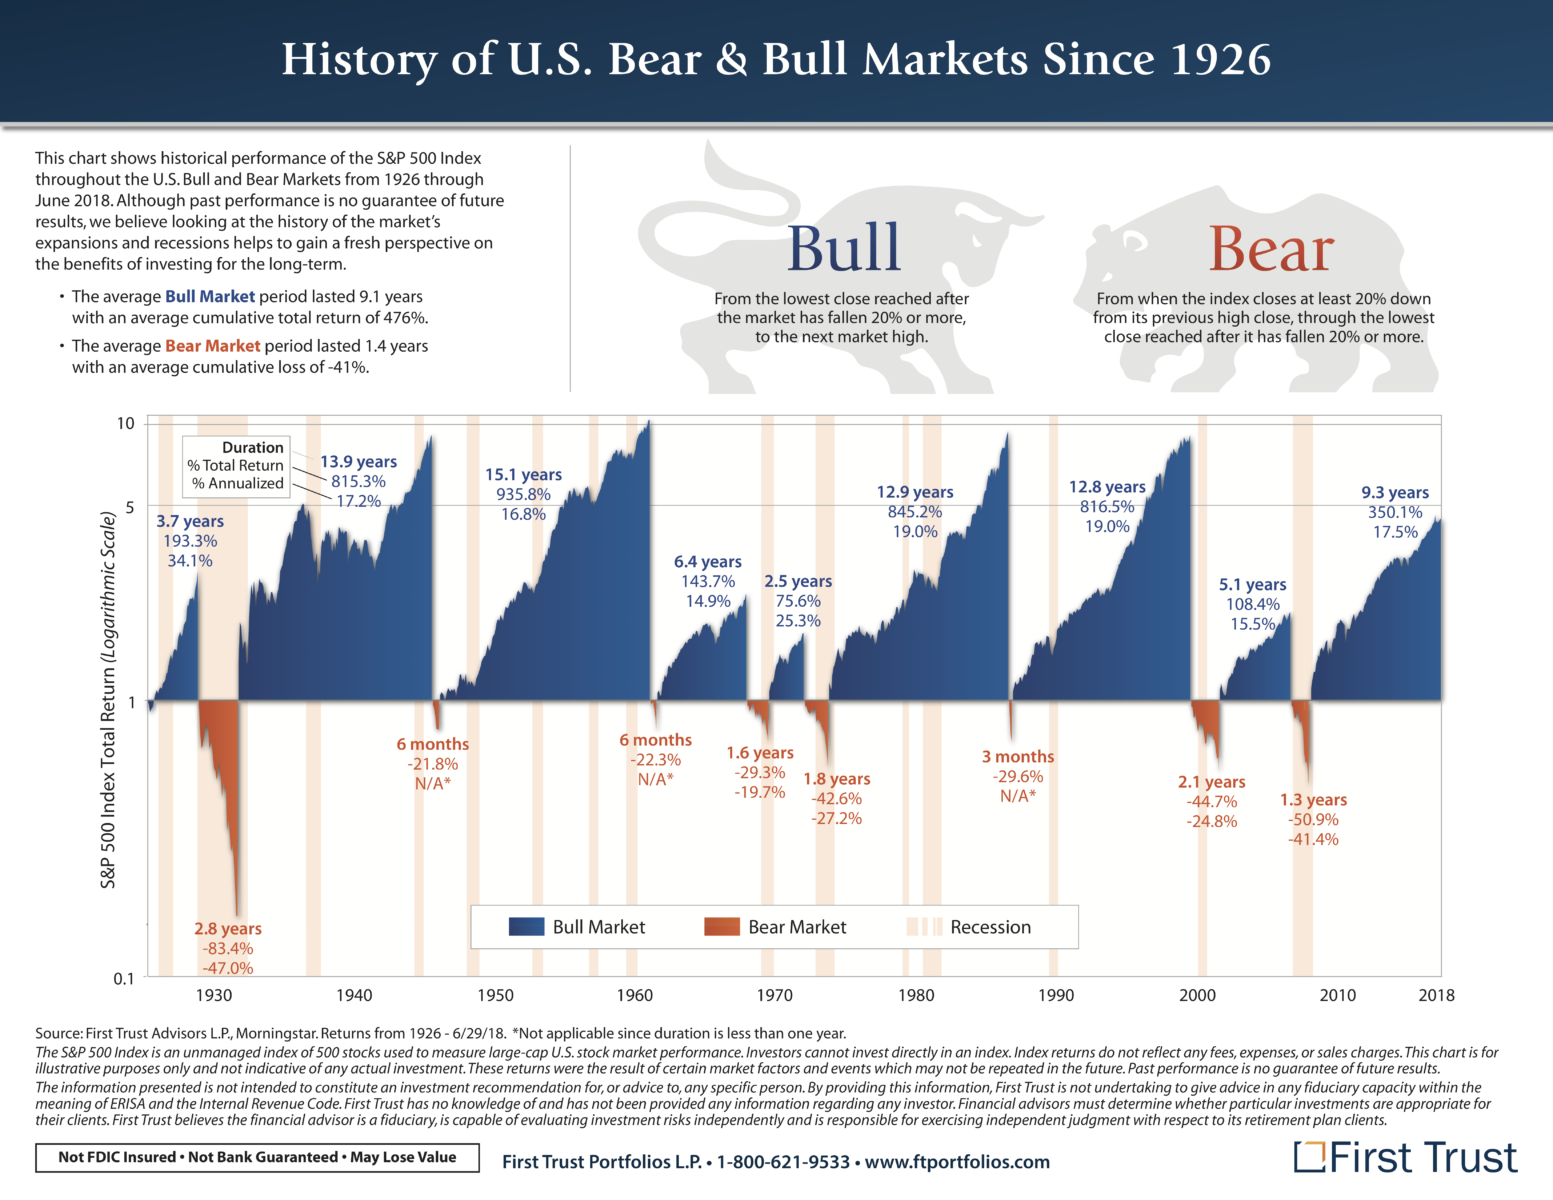 click for ginormous graphic Source: First Trust I really like this graphic, via First Trust, showing the history of bull and bear...
Read More
Why 2018 in Markets Feels So Awful We’re back to normal after 2017, an idyllic outlier in many respects. Bloomberg, April 18, 2018....
Read More
Markets Stopped Being Boring in the First Quarter After February, investors started freaking over almost everything. Bloomberg, March 29,...
Read More
 Pick Another Day to Celebrate the Bull Market’s Birthday Yes, the lows were on this day in March 2009. But the next...
Read More
