MiB: Joanne Bradford, Domain Money
She was previously president of Honey, where she orchestrated the company’s sale to PayPal Holdings Inc. for $4 billion. She...

 Physics and material sciences are awesome. I have no doubt that by the end of this century decade (if not sooner), we will...
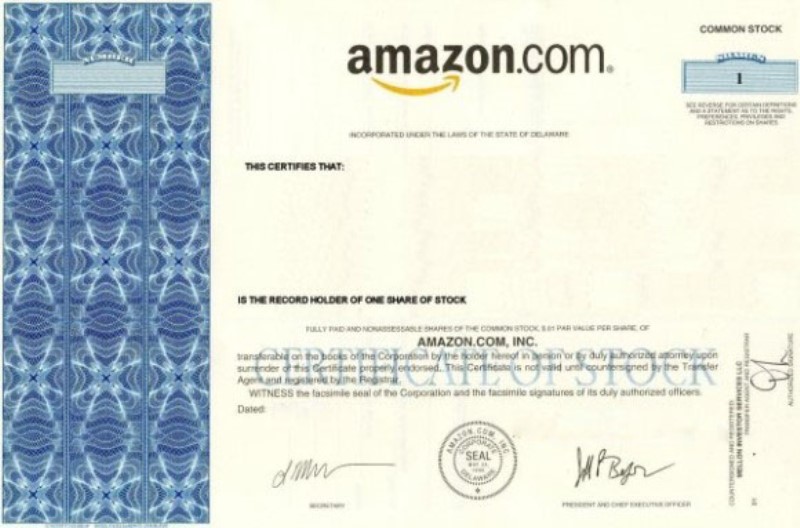 In August of 2022, I explained how Amazon became ordinary. Today I want to discuss how they have become bad. Since I first...
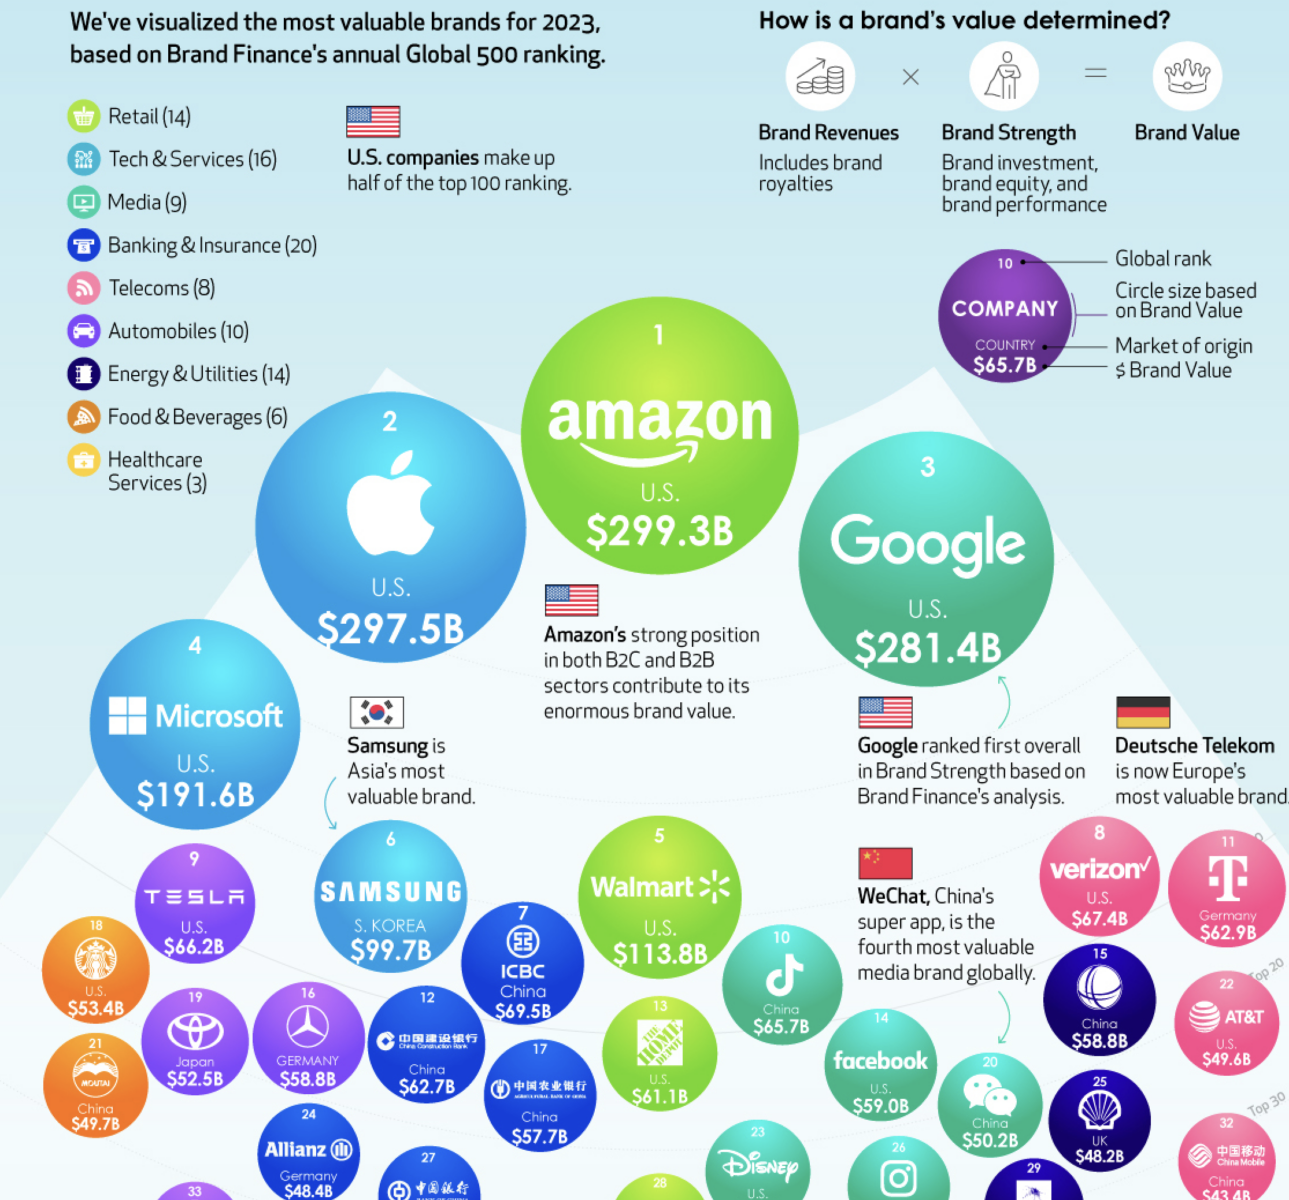 I am a sucker for a good infographic. This depiction of the top 100 brands by Brand Finance (via Visual Capitalist) is a good...
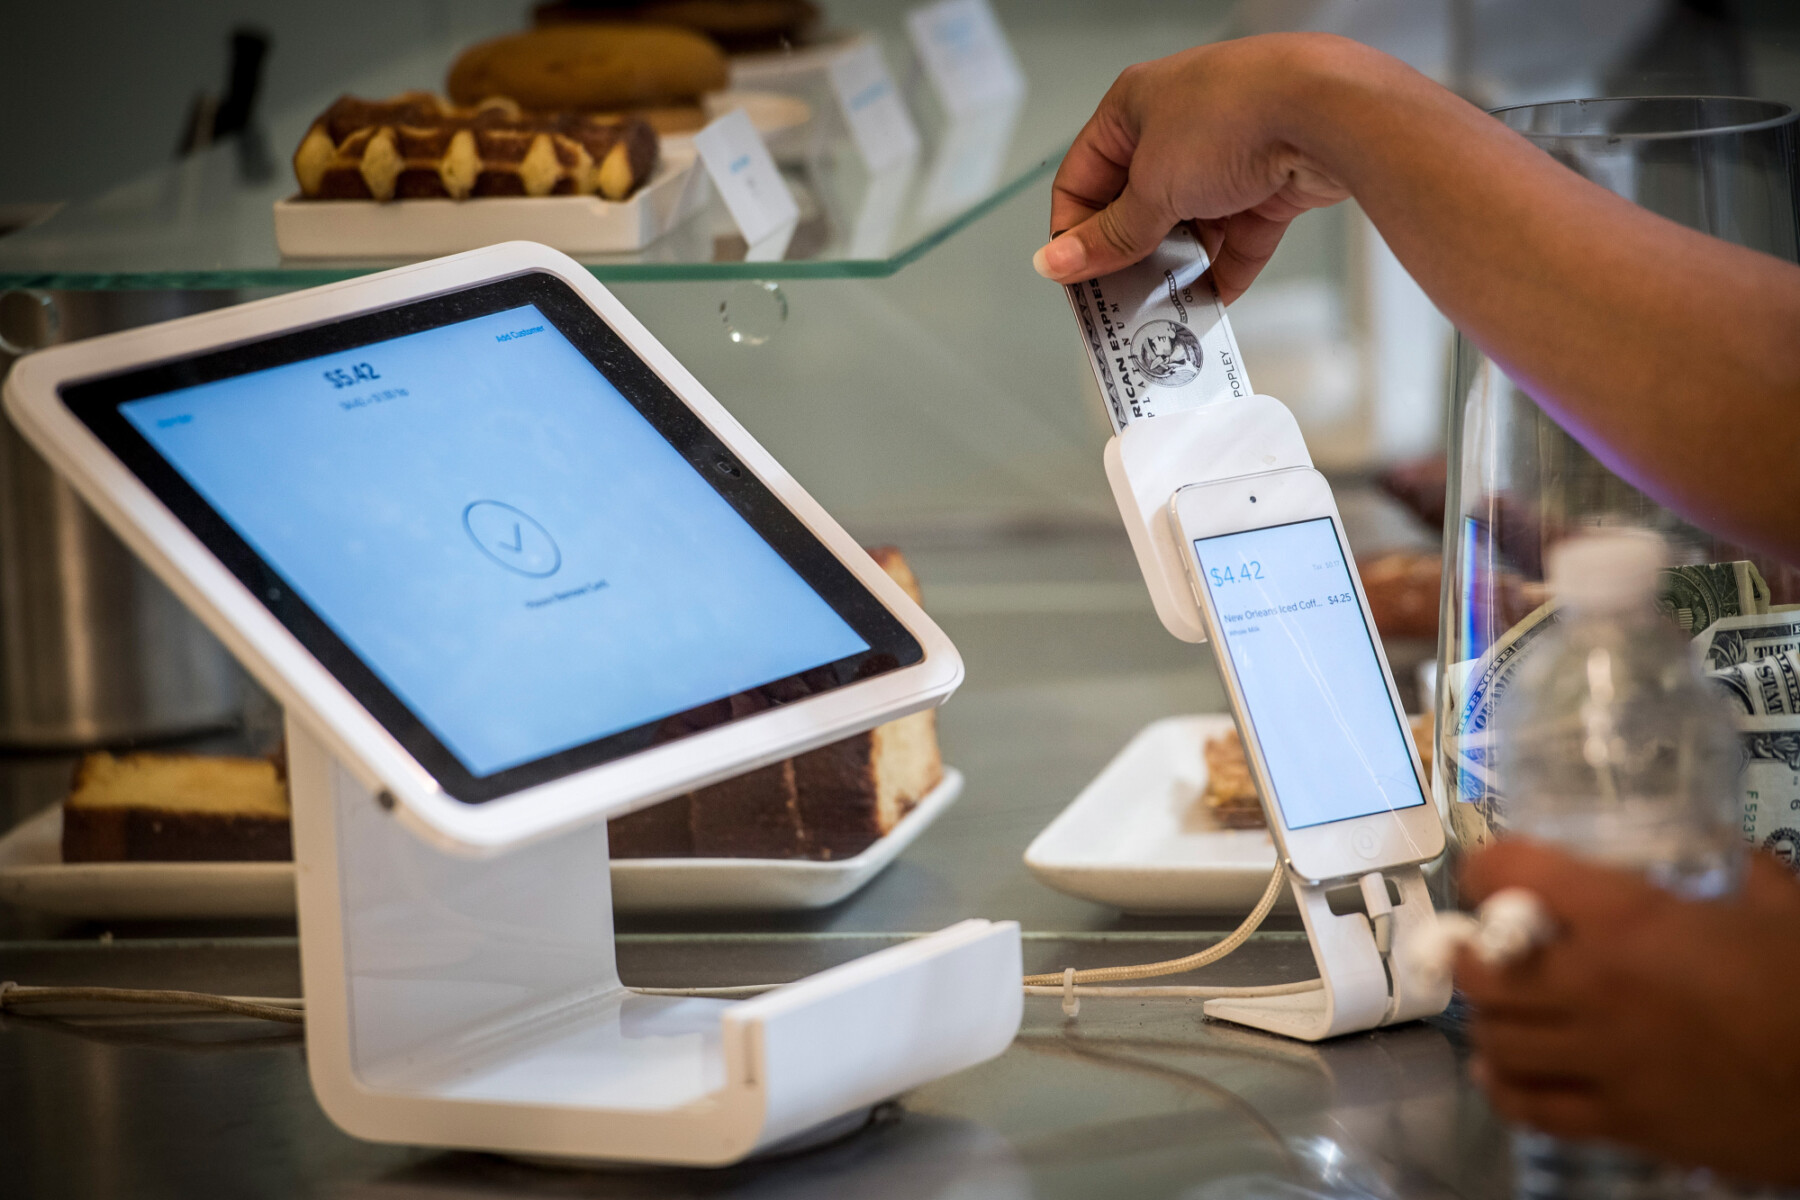 I have a new thesis I have been noodling around with: All of those Square credit card processing machines you use to pay for...
Get subscriber-only insights and news delivered by Barry every two weeks.