Now And Then
Spotify: YouTube: Do they think we’re deaf? Why can’t they leave well enough alone? And going straight to the...

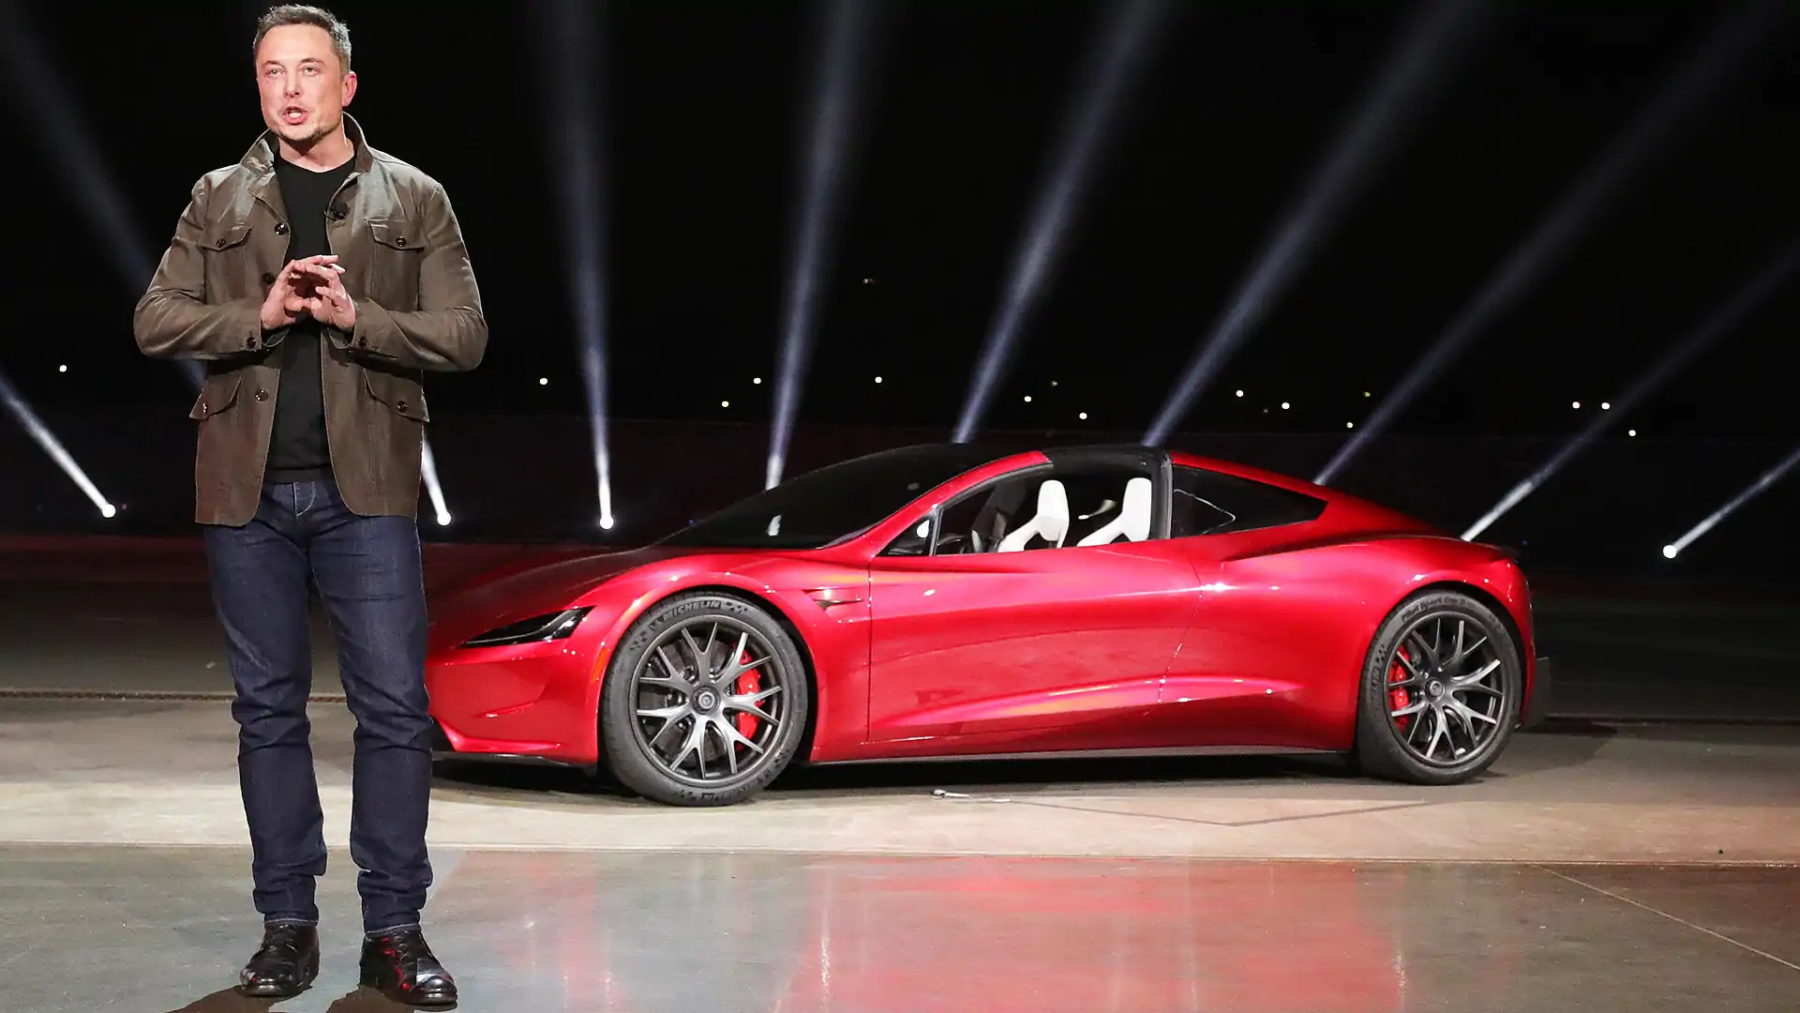 I don’t know anyone who will buy another Tesla. And I know a lot of people with Teslas, and they LOVE their Teslas! But they...
 You don’t know everything. And if you pretend to know everything, those who know something will dismiss you. Used to be a...
 Let’s start with the fees. Everybody wants them baked in, except for the acts. Ironically, even those acts complaining about the...
 It’s not politics, it’s cultural identity. I’d say this is why you should never believe someone when they...
 Art Cashin is a Wall Street treasure, and his annual shares are always appreciated. This is his December 23rd commentary. Happy...
 Note: This Bob Lefsetz piece is from earlier this year; I have been waiting to see how the Twitter deal might progress or...
Get subscriber-only insights and news delivered by Barry every two weeks.