Jack Rivkin, Wall Street Research Giant
He was a warm and witty observer of the investment business, and was best-known for his work running Shearson Lehman Brothers’...

 My early morning train pre-fishing reads: • Vanguard’s Gain Is Wall Street’s Pain as Billions Leave the Financial...
 James Bianco is president of Bianco Research, an institutional research and analytics firm. Since November 1990, he has been...
 On May 31, I am keynoting the CFA Society conference in the Cayman Islands, discussing the concept of What...
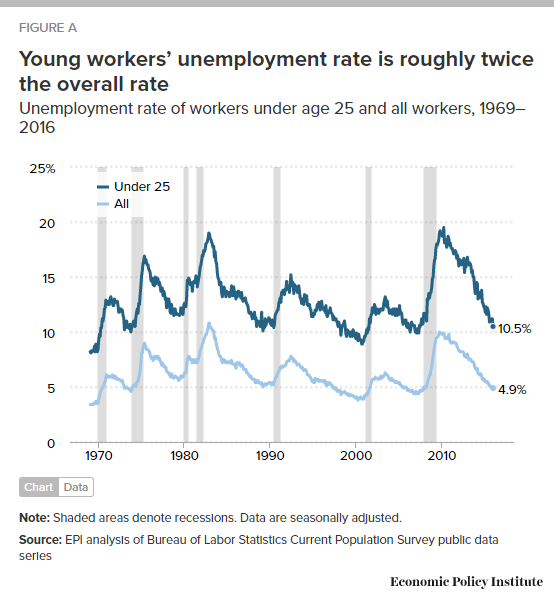 Interesting look at millenial employment via EPI: Source: Economic Policy Institute
Get subscriber-only insights and news delivered by Barry every two weeks.