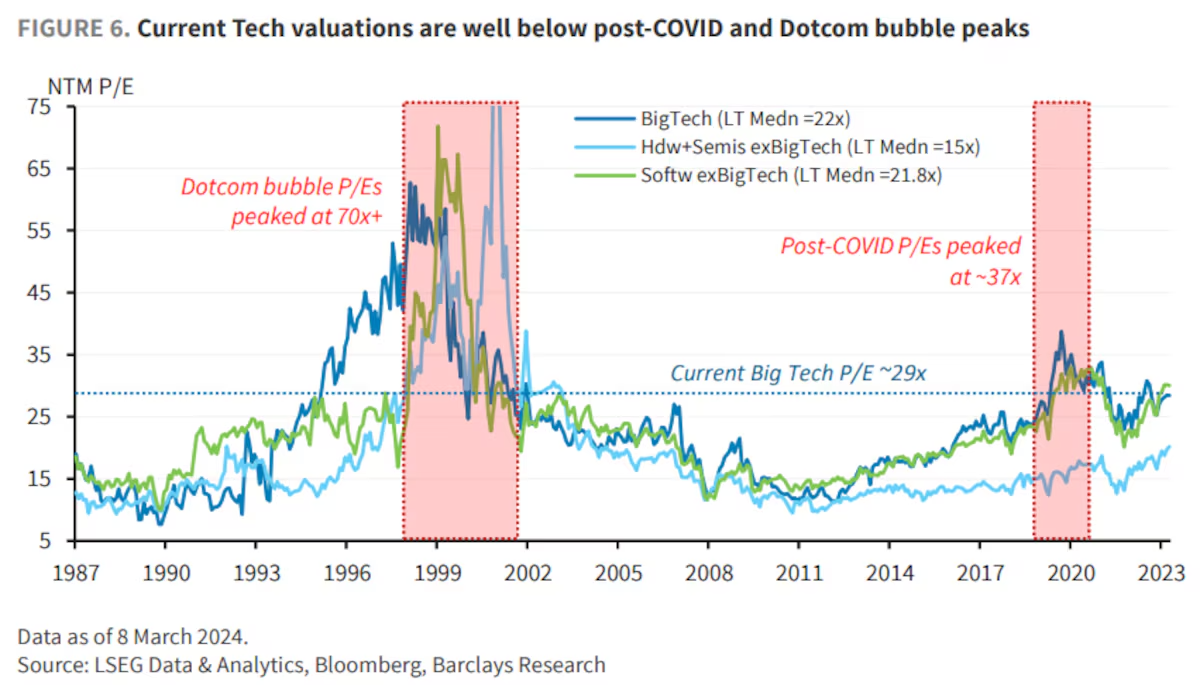
 The weekend is here! Pour yourself a mug of coffee, grab a seat by the fire, and get ready for our longer-form weekend reads: • Covid...
Read More
This week, we speak with Ed Hyman, founder and chairman of Evercore ISI International Ltd. and vice chairman of Evercore...
Read More
At The Money: with Jim Bianco, President Bianco Research (April, 03, 2024) Interest rates have risen by over 500 basis...
Read More
The transcript from this week’s, MiB: Angus Deaton on America’s Wealth & Inequality, is below. You can stream...
Read More
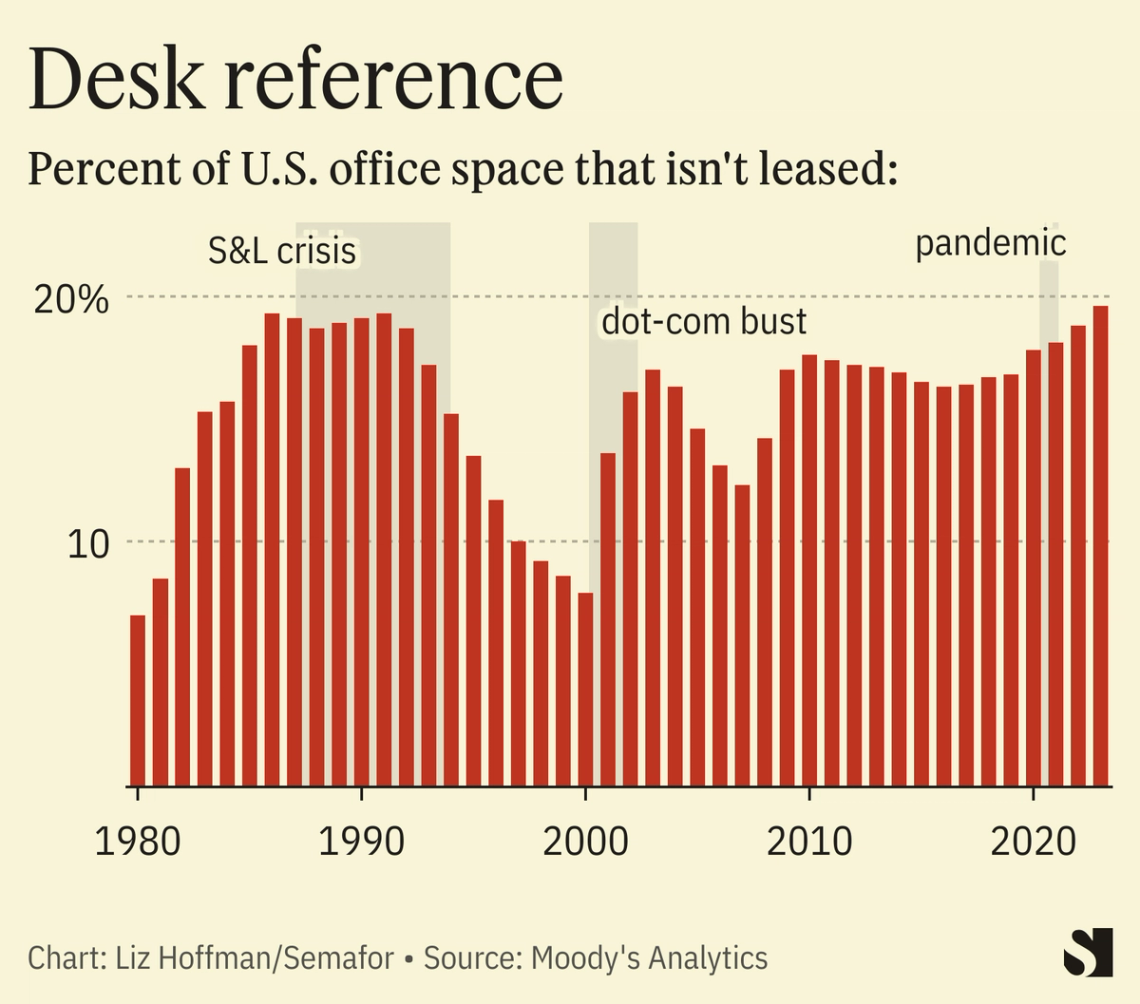
 Avert your eyes! My Sunday morning look at incompetency, corruption and policy failures: • Remember the Silicon Valley Bank Disaster?...
Read More
 The weekend is here! Pour yourself a mug of coffee, grab a seat by the fire, and get ready for our longer-form weekend reads: • Are...
Read More
This week, we speak with Sir Angus Deaton, who was awarded the Nobel Memorial Prize in Economic Sciences in...
Read More
“Our comforting conviction that the world makes sense rests on a secure foundation: Our almost unlimited ability to...
Read More
At The Money: with Liz Ann Sonders, CIO Schwab (March 27, 2024) The past few years have seen market swings wreak...
Read More
The transcript from this week’s, MiB: Liz Ann Sonders, Schwab Chief Investment Strategist, is below. You can stream and...
Read More
